. 2010 Feb 17;98(4):637-45.
doi: 10.1016/j.bpj.2009.08.061.

TEM-1 backbone dynamics-insights from combined molecular dynamics and nuclear magnetic resonance

Affiliations

TEM-1 backbone dynamics-insights from combined molecular dynamics and nuclear magnetic resonance

Olivier Fisette et al. Biophys J. .

Abstract

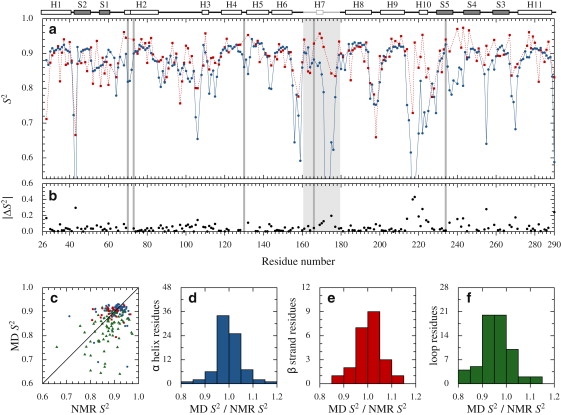
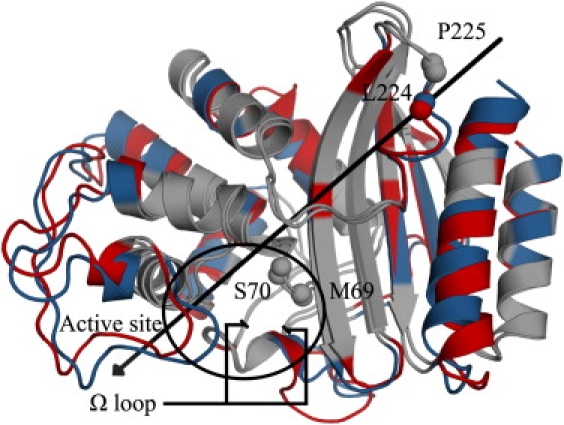
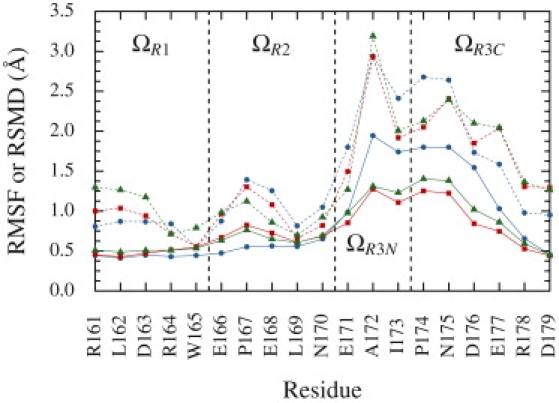
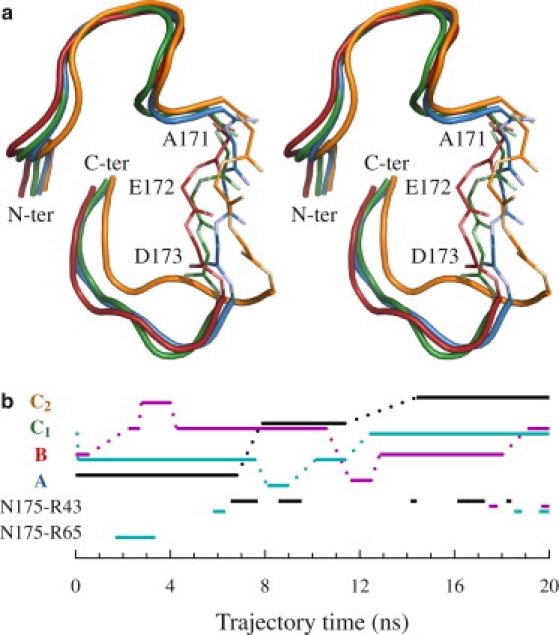
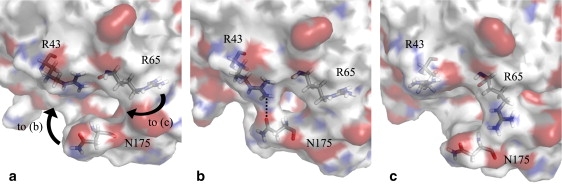
Dynamic properties of class A beta-lactamase TEM-1 are investigated from molecular dynamics (MD) simulations. Comparison of MD-derived order parameters with those obtained from model-free analysis of nuclear magnetic resonance (NMR) relaxation data shows high agreement for N-H moieties within alpha- and beta-secondary structures, but significant deviation for those in loops. This was expected, because motions slower than the protein global tumbling often take place in loop regions. As previously shown using NMR, TEM-1 is a highly ordered protein. Motions are observed within the Omega loop that could, upon substrate binding, stabilize E166 in a catalytically efficient position as the cavity between the protein core and the Omega loop is partially filled. The rigidity of active site residues is consistent with the enzyme high turnover number. MD data are also shown to be useful during the model selection step of model-free analysis: local N-H motions observed over the course of the trajectories help assess whether a peptide plan undergoes low or high amplitude motions on one or more timescales. This joint use of MD and NMR provides a better description of protein dynamics than would be possible using either technique alone.


Figures

Figure 1
Figure 1
S2 parameters from NMR spectroscopy and MD simulations along the TEM-1 sequence and their correlation. (a) S2. MD results (calculation method M2) are blue circles and solid line; relax analysis results are red squares and dashed line. (b) |ΔS2|. Between MD and relax. (a and b) Catalytic residues (S70, K73, S130, E166, and K234) are indicated with gray lines, the Ω loop with a light gray box. Above panel a is the TEM-1 sequence; α-helices are white boxes, β-strands gray boxes; the Ω loop is in light gray; a vertical bar in H2 indicates the bend between H2A and H2B. (c) MD against relax S2. Residues in α-helices are blue circles; those in β-strands are red squares; those in loops are green triangles. (d–f) Ratio of MD and relax S2 for residues in α-helices (d), β-strands (e), and loops (f).
Figure 2
Figure 2
Amide N-H bond local motions in MD simulations. For each snapshot in all simulations, the orientation of the selected residue N-H amide bond (in the local reference frame used for M1 and M2) is plotted on a cylindrical map projection (latitude (ϕ) versus longitude (Λ)). Isolines follow vector orientation density in rad−2ns−1; they are: 50, 100, 200, and 400. Mean orientation is centered at the origin.
Figure 3
Figure 3
Essential dynamics first component. Minimal and maximal eigenvector projections observed in the first simulation are superposed. Colored residues are the most mobile ones (blue and red for the minimum and maximum projections, respectively). The α-domain rotates clockwise around the axis (black arrow). The α-carbons of hinge residues M69, S70, L224, and P225 are shown as spheres. The active site and Ω loop extremities are shown (black circle and lines). Movies showing the five principal components are supplied as Supporting Material.
Figure 4
Figure 4
Ω Loop flexibility. Solid lines are Cα RMSF to the average structure. Dashed lines are time-averaged Cα RMSD to the crystallographic structure. Blue circles, red squares, and green triangles refer to the first, second, and third simulation, respectively. Vertical dashed lines separate Ω loop regions as described in the text.
Figure 5
Figure 5
Ω Loop conformations. (a) Structure with ΩR3N conformations. The whole Ω loop is in cartoon representation, except for residues E171, A172, and I173 (ΩR3N) which are shown as sticks (along with atoms CO and OC from N170 and atoms CO, OC, and NH from P174). Conformations A, B, C1, and C2 are in blue, red, green, and orange, respectively. Oxygen and nitrogen atoms in stick representation are paler than other atoms. Stereoscopic figure. (b) Simulation timeline. (Upper portion) ΩR3N conformations. (Lower portion) Interactions between N175 Oδ and R43 Nη and between N175 Oδ and R65 Nη in ΩR3C (cavity-filling motions). Conformations and interactions are labeled on the left. Black, magenta, and cyan lines refer to the first, second, and third simulation, respectively. Interaction cutoffs are 3.0 Å distance and 90° angle for the hydrogen bond between N175 Oδ and R43 Nη, and 4.0 Å distance for the R65 side-chain motion that brings N175 Oδ and R65 Nη closer.
Figure 6
Figure 6
Cavity-filling motions in the Ω loop. Residues R45, R65, and N175 are shown as sticks. (a) Crystal structure 1XPB (simulation starting point). (b) N175 approaches the protein core; a hydrogen bond is formed between N175 Oδ and R43 Nη; first simulation, at 9.0 ns. (c) R65 side chain rotates toward the cavity, partially filling it; third simulation, at 3.0 ns.

References

    1. Caballero-Manrique E., Bray J.K., Guenza M.G. A theory of protein dynamics to predict NMR relaxation. Biophys. J. 2007;93:4128–4140. - PMC - PubMed
    1. Savard P.-Y., Gagné S.M. Backbone dynamics of TEM-1 determined by NMR: evidence for a highly ordered protein. Biochemistry. 2006;45:11414–11424. - PubMed
    1. Lamotte-Brasseur J., Lounnas V., Wade R.C. pKa calculations for class A β-lactamases: influence of substrate binding. Protein Sci. 1999;8:404–409. - PMC - PubMed
    1. Hermann J.C., Ridder L., Höltje H.D. Identification of Glu166 as the general base in the acylation reaction of class A β-lactamases through QM/MM modeling. J. Am. Chem. Soc. 2003;125:9590–9591. - PubMed
    1. Meroueh S.O., Fisher J.F., Mobashery S. Ab initio QM/MM study of class A β-lactamase acylation: dual participation of Glu166 and Lys73 in a concerted base promotion of Ser70. J. Am. Chem. Soc. 2005;127:15397–15407. - PubMed

Publication types