

Review
doi: 10.1016/j.neuron.2009.12.022.
Imaging the human medial temporal lobe with high-resolution fMRI
Affiliations
- PMID: 20159444
- PMCID: PMC2844113
- DOI: 10.1016/j.neuron.2009.12.022
Item in Clipboard
Review
Imaging the human medial temporal lobe with high-resolution fMRI
Neuron.
.
Abstract
High-resolution functional MRI (hr-fMRI) affords unique leverage on the functional properties of human medial temporal lobe (MTL) substructures. We review initial hr-fMRI efforts to delineate (1) encoding and retrieval processes within the hippocampal circuit, (2) hippocampal subfield contributions to pattern separation and pattern completion, and (3) the representational capabilities of distinct MTL subregions. Extant data reveal functional heterogeneity within human MTL and highlight the promise of hr-fMRI for bridging human, animal, and computational approaches to understanding MTL function.
Copyright 2010 Elsevier Inc. All rights reserved.
Figures
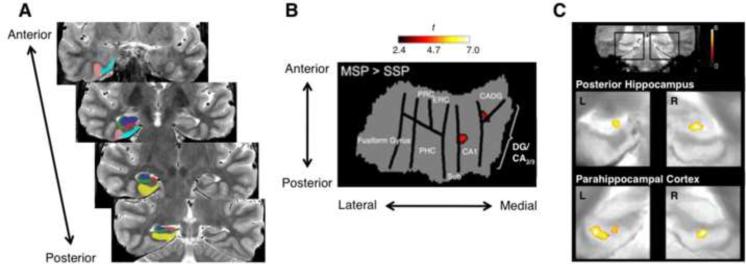
(a) High-resolution anatomical images of human MTL displaying manually-drawn hippocampal ROIs: CA1 (green), DG/CA2/3 (blue), and the subiculum (red), as well as PRC (pink), ERC (cyan) and PHC (yellow). (b) Group subfield activity projected onto a flattened representation of the MTL demonstrating greater CA1 involvement in navigating a virtual town from multiple (MSP) relative to single starting points (SSP) (modified from Suthana et al., 2009). (c) Group-level statistical maps overlaid on a representative participant's anatomical images demonstrating performance-related probe period activity on a delayed-match-to-sample task in posterior hippocampal and parahippocampal regions (modified from Olsen et al., 2009).

(a) Subfield activity projected onto a flattened representation of the MTL demonstrating encoding activity in DG/CA2/3 and retrieval activity in the subiculum. Flatmap is accompanied by bar graphs indicating averaged activity in DG/CA2/3 and the subiculum across four consecutive blocks in which participants encoded and recalled the same face-name associations (modified from Zeineh et al., 2003). (b) Averaged subicular activity in response to faces and scenes presented once or repeatedly. Stimuli presented once were subsequently tested outside the scanner, with memory performance used to back-sort encoding trials as recognized with high confidence, low confidence, or missed (modified from Preston et al., 2010).

(a) Sample stimuli illustrating original and lure versions of objects. Activation clusters (white overlay) in DG/CA2/3 (red) and CA1 (blue) demonstrating biases toward pattern separation and completion, respectively. Bar graphs represent averaged activity extracted from each functional ROI in response to first presentation, repeat, and lure trials (modified from Bakker et al., 2008). (b) Timecourse activity extracted from anatomically defined regions of interest demonstrating delay period activity correlated with memory performance. Bar graphs depict mean signal change during study, delay, and probe (modified from Olsen et al., 2009).

Scattergrams depict the accuracy with which objects were differentiated from scenes (left) and different classes of objects from one-another (right) in the hippocampus, PHC and PRC using MVPA classifiers trained and tested on the data of individual participants (colored squares). Chance performance is indicated by the dashed line (modified from Diana et al., 2008).
References
-
- Bar M, Aminoff E. Cortical analysis of visual context. Neuron. 2003;38:347–358. - PubMed
-
- Bellgowan PS, Bandettini PA, van Gelderen P, Martin A, Bodurka J. Improved BOLD detection in the medial temporal region using parallel imaging and voxel volume reduction. Neuroimage. 2006;29:1244–1251. - PubMed
-
- Bird CM, Burgess N. The hippocampus and memory: insights from spatial processing. Nat Rev Neurosci. 2008;9:182–194. - PubMed
Publication types
MeSH terms
Substances
Grants and funding
LinkOut - more resources
Full Text Sources
Other Literature Sources
Medical
