

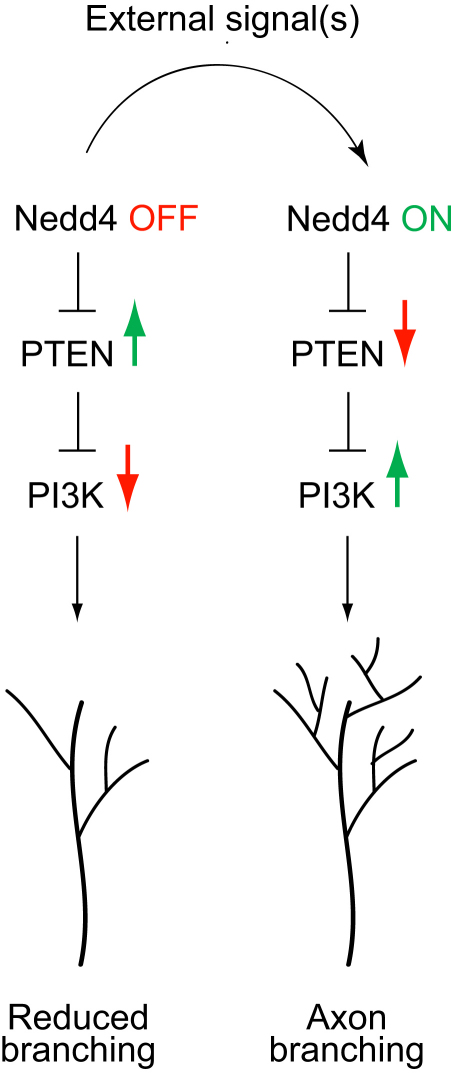
E3 ligase Nedd4 promotes axon branching by downregulating PTEN
- PMID: 20159448
- PMCID: PMC2862300
- DOI: 10.1016/j.neuron.2010.01.017
E3 ligase Nedd4 promotes axon branching by downregulating PTEN
Abstract
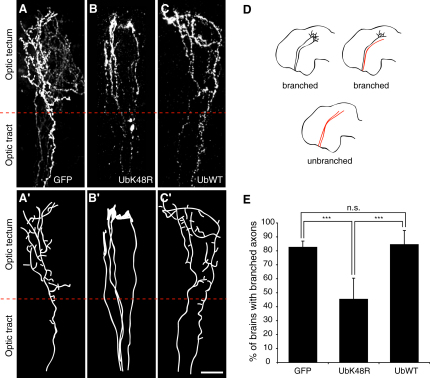
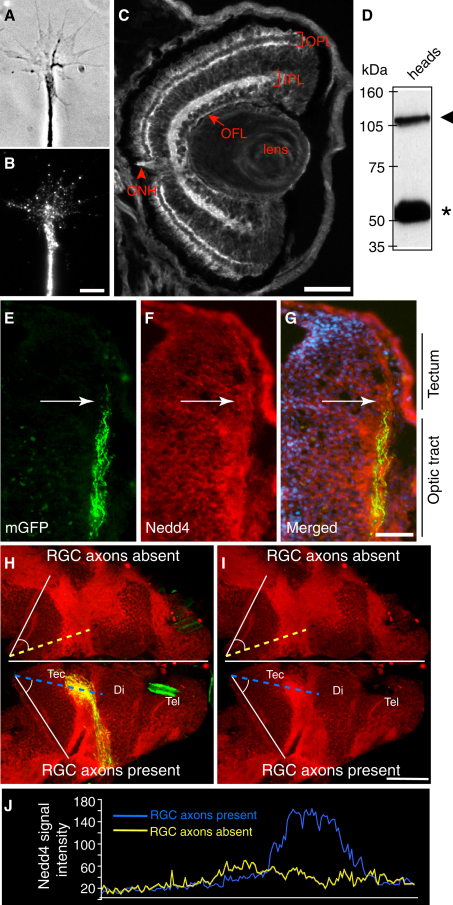
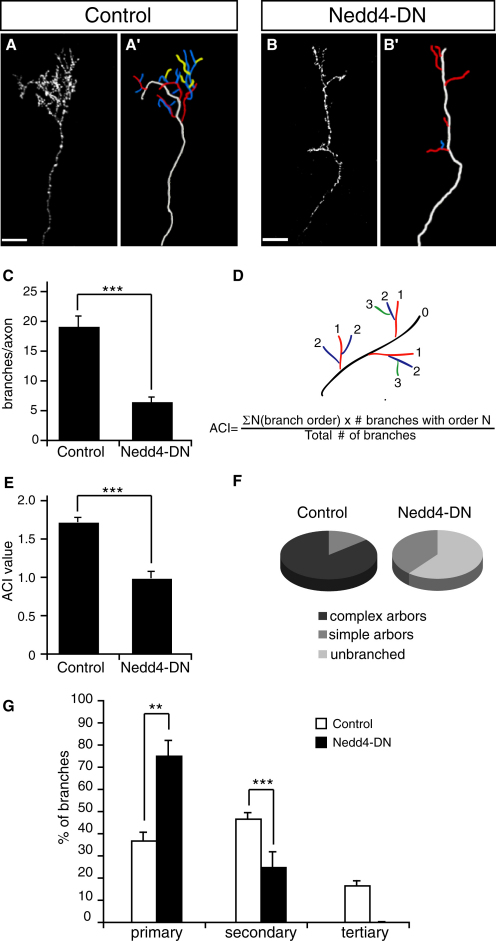
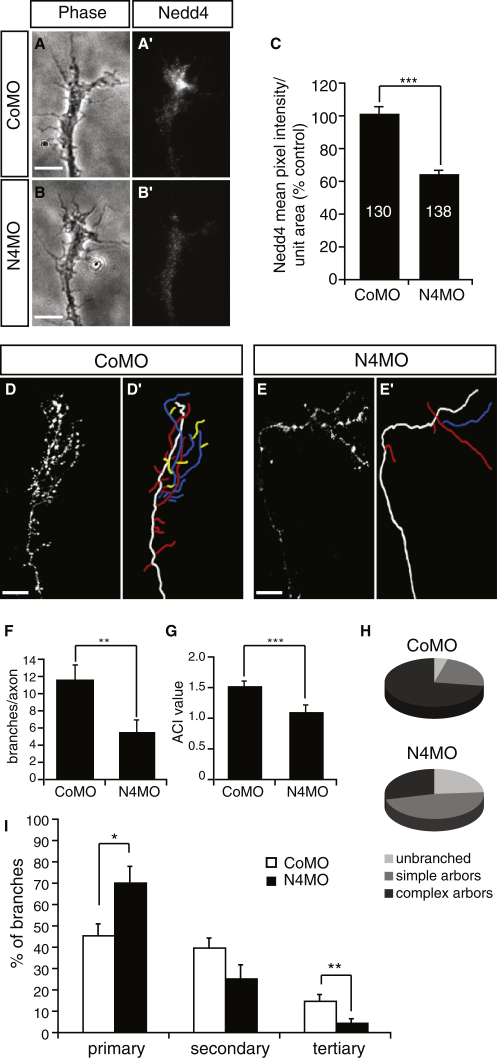
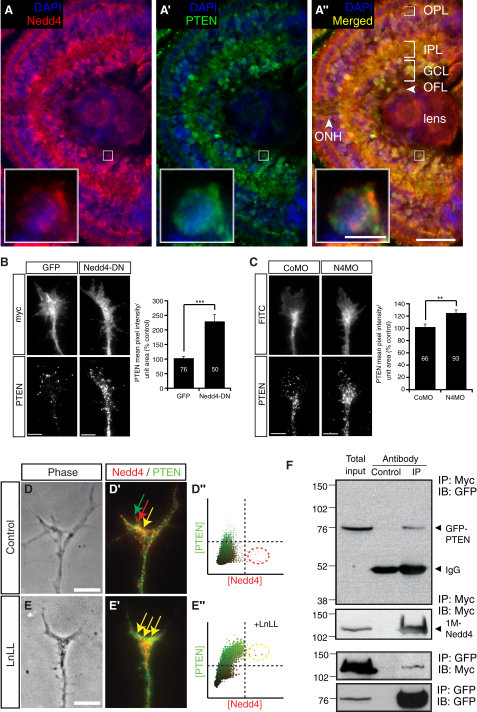
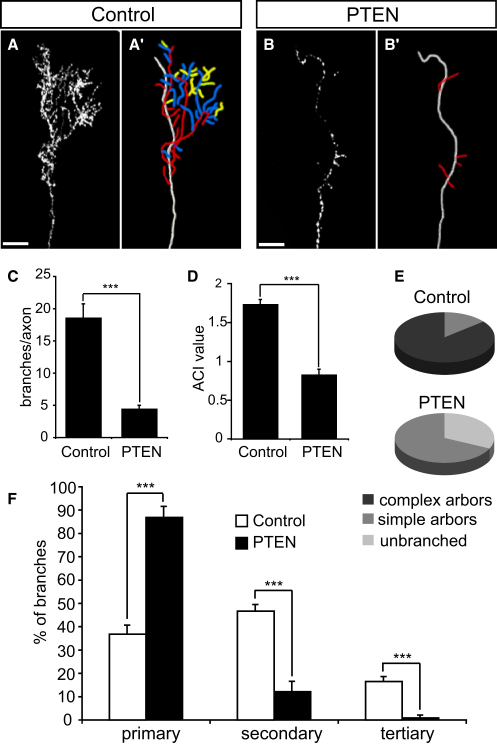
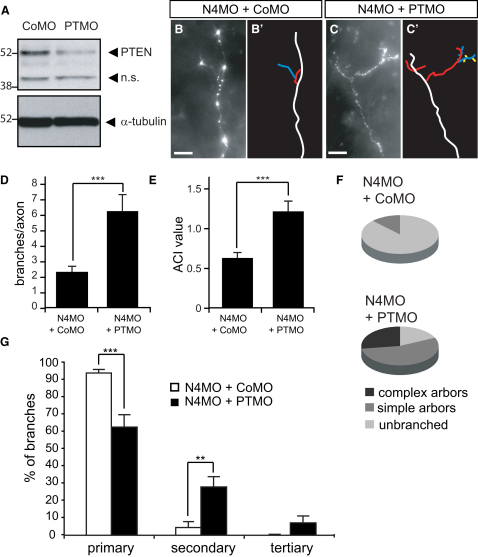
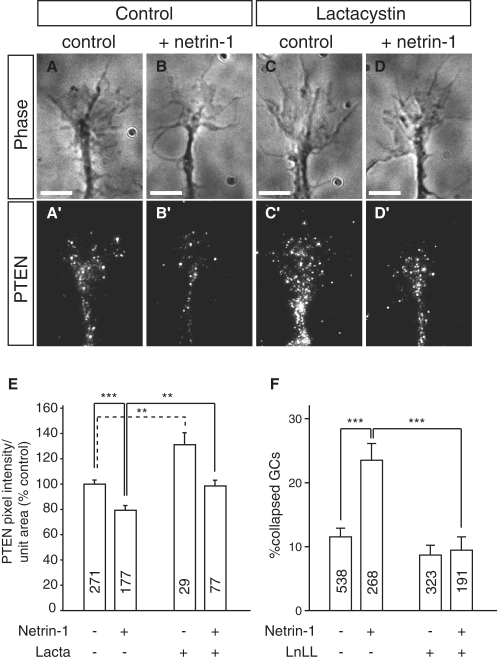
Regulated protein degradation via the ubiquitin-proteasome system (UPS) plays a central role in building synaptic connections, yet little is known about either which specific UPS components are involved or UPS targets in neurons. We report that inhibiting the UPS in developing Xenopus retinal ganglion cells (RGCs) with a dominant-negative ubiquitin mutant decreases terminal branching in the tectum but does not affect long-range navigation to the tectum. We identify Nedd4 as a prominently expressed E3 ligase in RGC axon growth cones and show that disrupting its function severely inhibits terminal branching. We further demonstrate that PTEN, a negative regulator of the PI3K pathway, is a key downstream target of Nedd4: not only does Nedd4 regulate PTEN levels in RGC growth cones, but also, the decrease of PTEN rescues the branching defect caused by Nedd4 inhibition. Together our data suggest that Nedd4-regulated PTEN is a key regulator of terminal arborization in vivo.
Copyright 2010 Elsevier Inc. All rights reserved.
Figures
Comment in
-
Nedd4 branches out.Neuron. 2010 Feb 11;65(3):293-4. doi: 10.1016/j.neuron.2010.01.028. Neuron. 2010. PMID: 20159442 Free PMC article.
References
-
- Ahn Y., Hwang C.Y., Lee S.R., Kwon K.S., Lee C. The tumor suppressor PTEN mediates a negative regulation of E3 ubiquitin-protein ligase Nedd4. Biochem. J. 2008;412:331–338. - PubMed
-
- Alsina B., Vu T., Cohen-Cory S. Visualizing synapse formation in arborizing optic axons in vivo: dynamics and modulation by BDNF. Nat. Neurosci. 2001;4:1093–1101. - PubMed
-
- Arévalo J.C., Waite J., Rajagopal R., Beyna M., Chen Z.Y., Lee F.S., Chao M.V. Cell survival through Trk neurotrophin receptors is differentially regulated by ubiquitination. Neuron. 2006;50:549–559. - PubMed
-
- Brose K., Tessier-Lavigne M. Slit proteins: key regulators of axon guidance, axonal branching, and cell migration. Curr. Opin. Neurobiol. 2000;10:95–102. - PubMed
Publication types
MeSH terms
Substances
Grants and funding
LinkOut - more resources
Full Text Sources
Other Literature Sources
Research Materials
