. 2010 Feb 11;65(3):373-84.
doi: 10.1016/j.neuron.2010.01.005.

Regulation of synaptic structure and function by FMRP-associated microRNAs miR-125b and miR-132

Affiliations

Regulation of synaptic structure and function by FMRP-associated microRNAs miR-125b and miR-132

Dieter Edbauer et al. Neuron. .

Erratum in

  • Neuron. 2010 Oct 6;68(1):161

Abstract

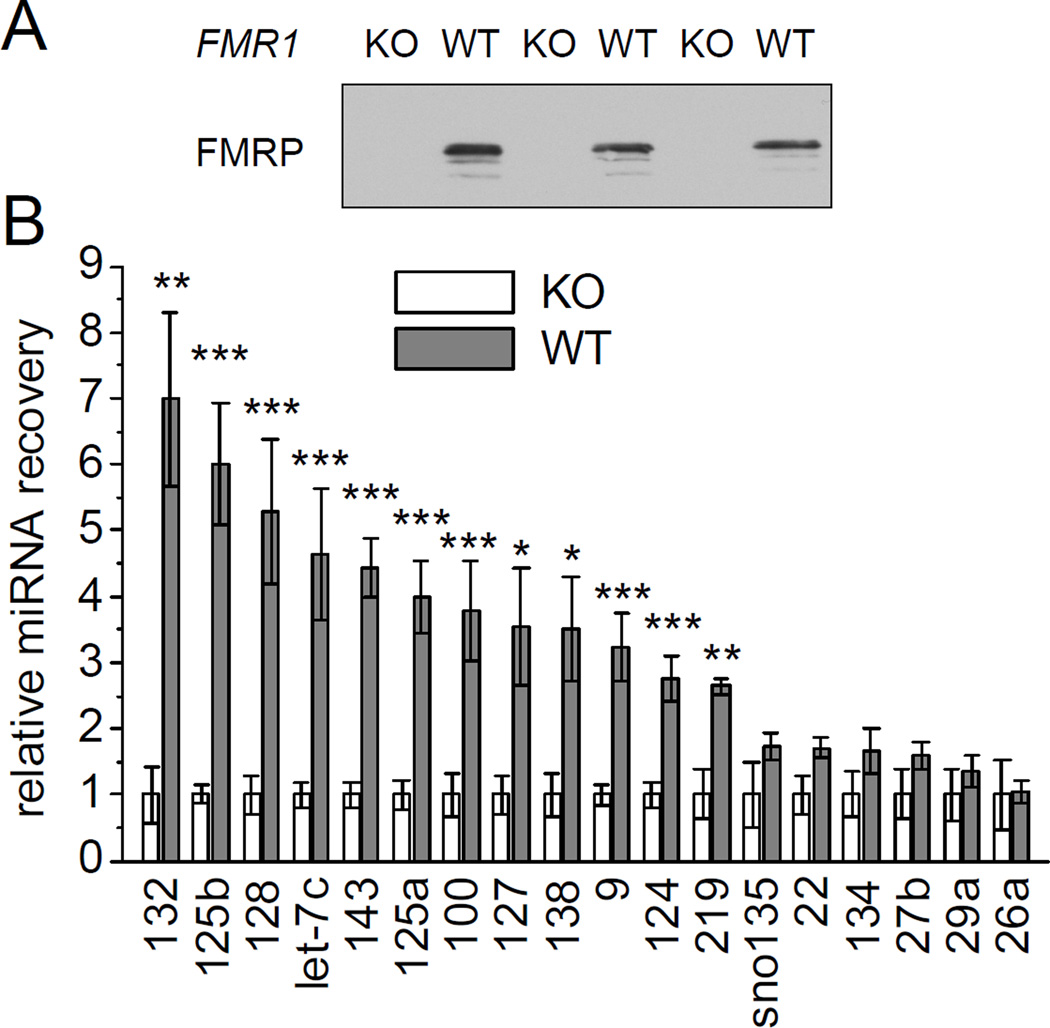
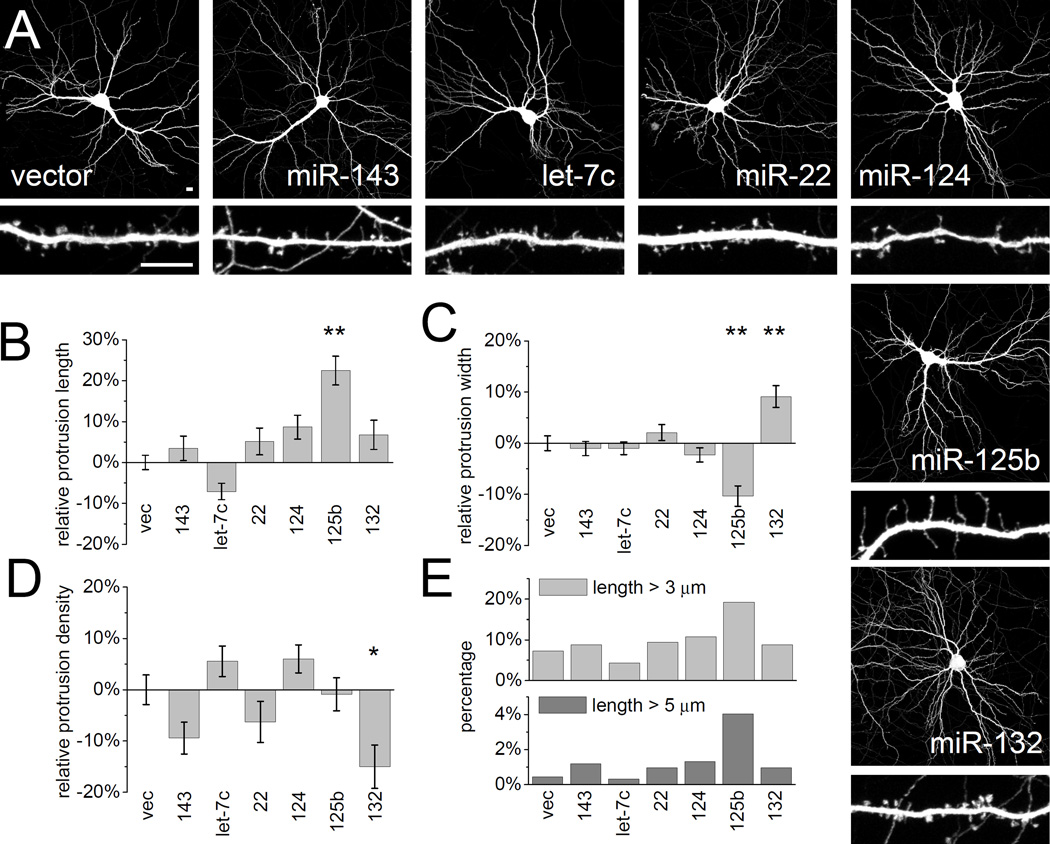
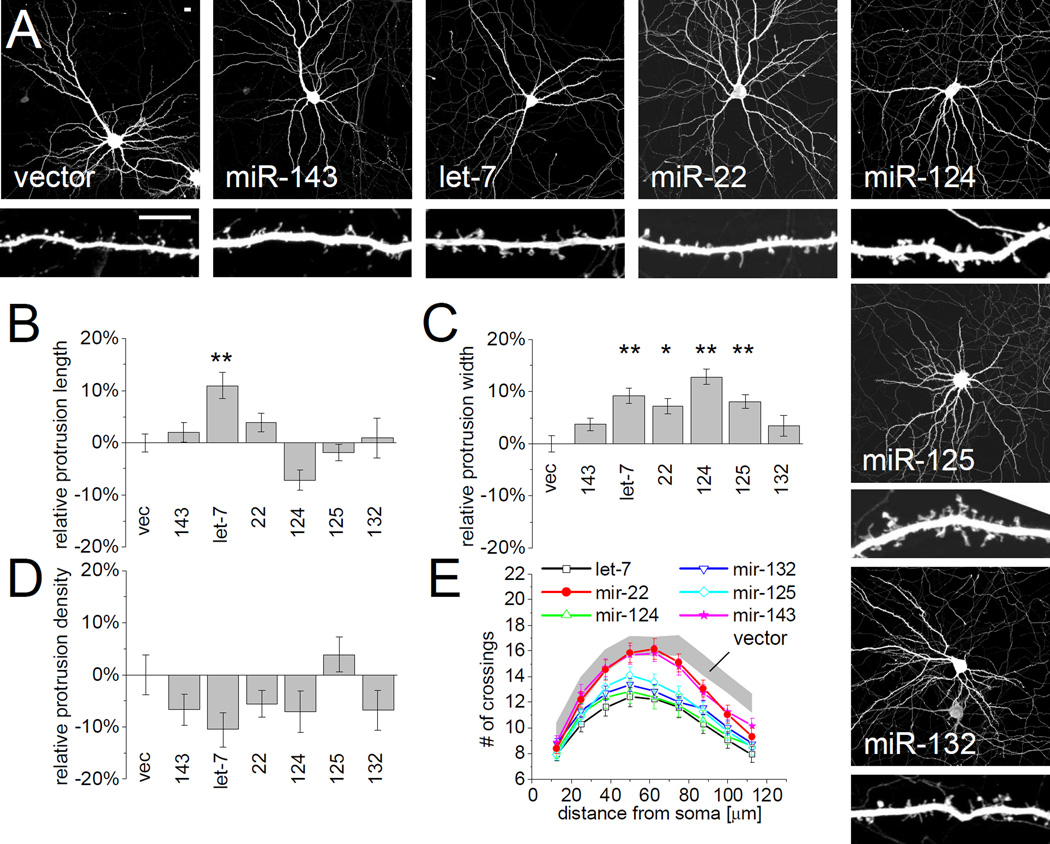
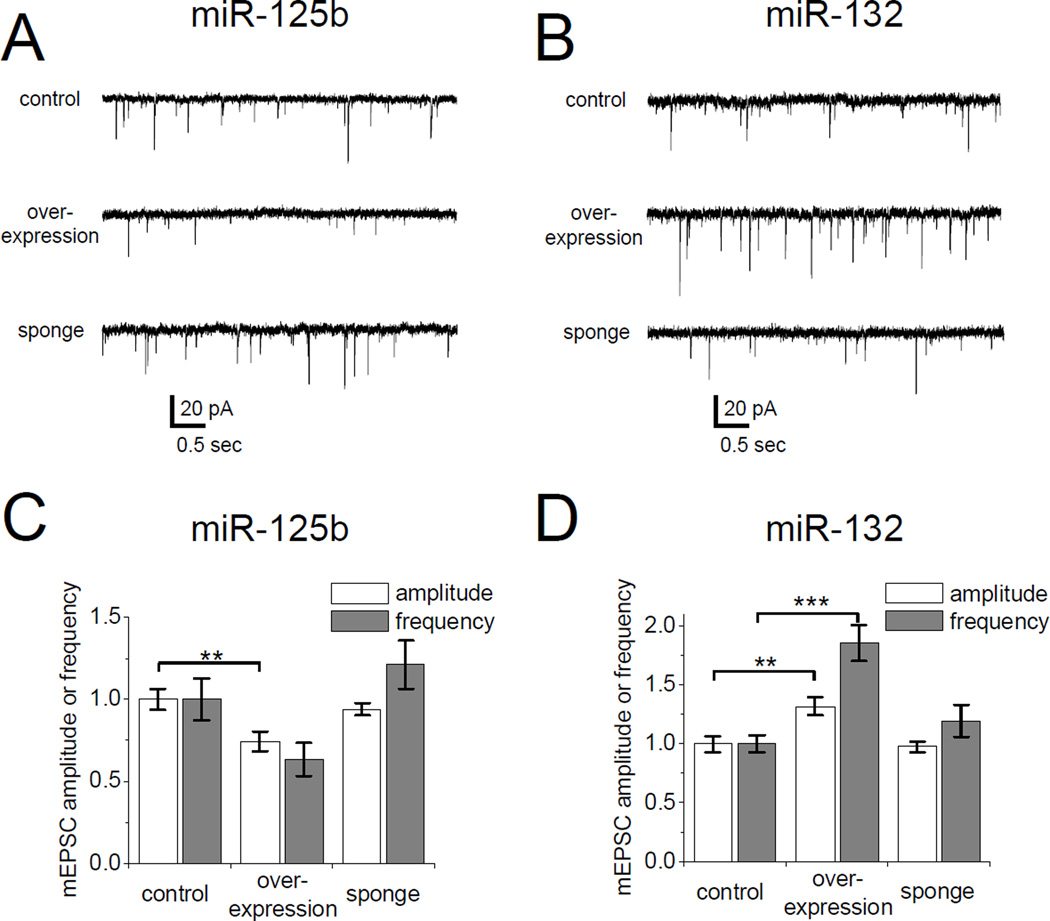
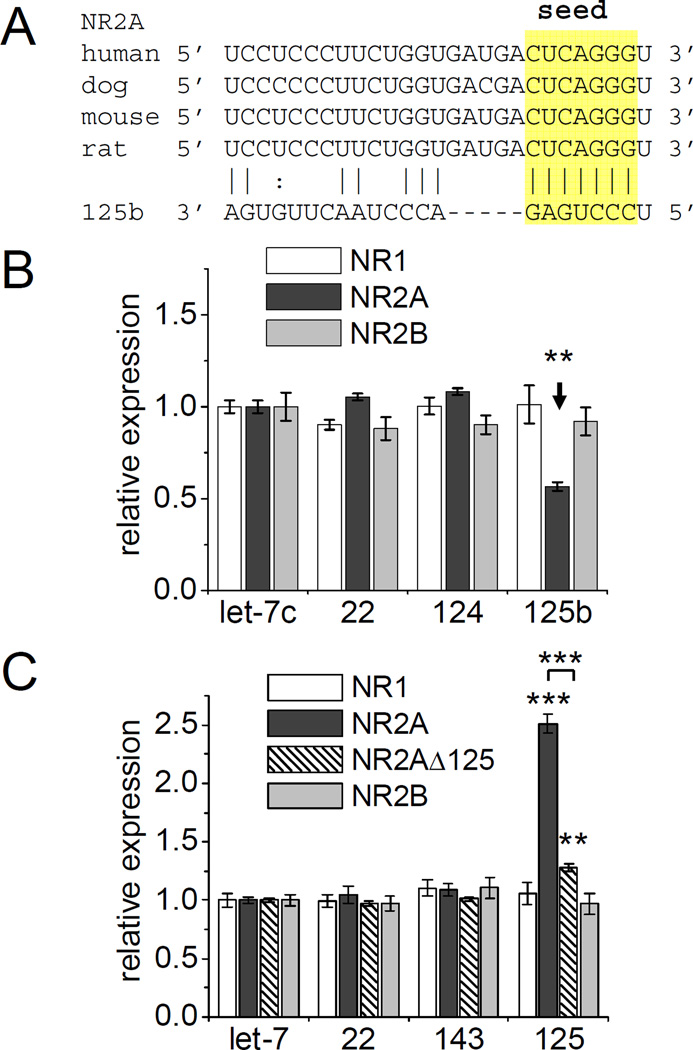
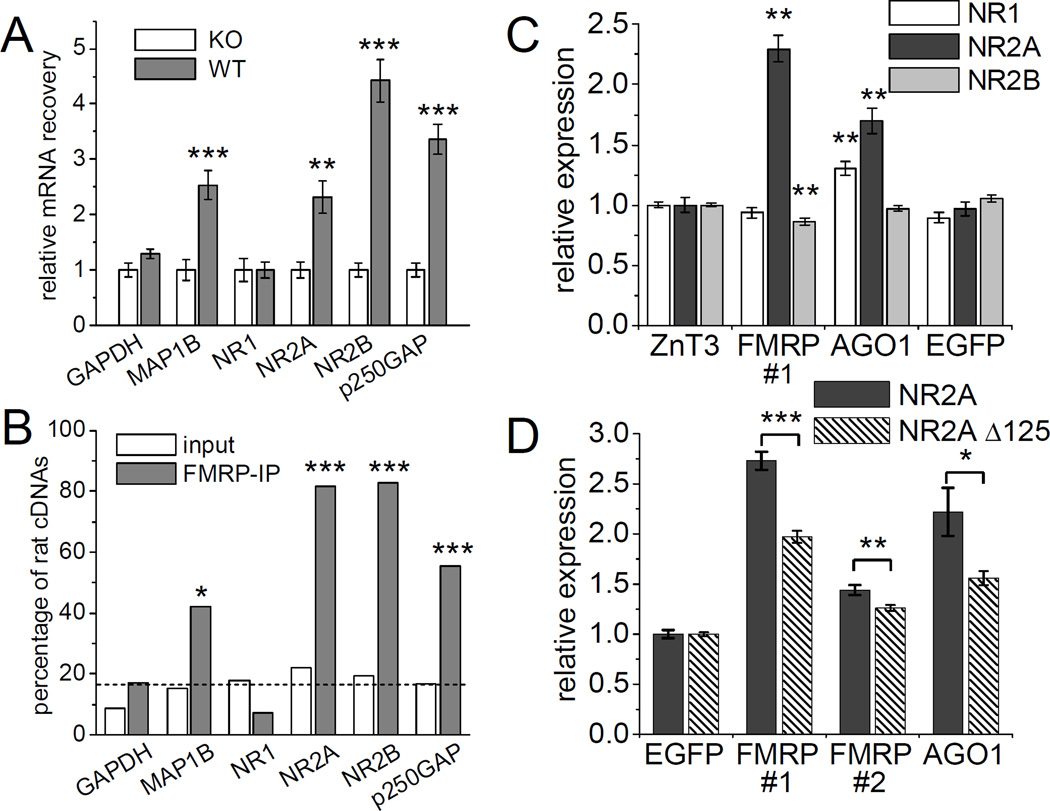
MicroRNAs (miRNAs) are noncoding RNAs that suppress translation of specific mRNAs. The miRNA machinery interacts with fragile X mental retardation protein (FMRP), which functions as translational repressor. We show that miR-125b and miR-132, as well as several other miRNAs, are associated with FMRP in mouse brain. miR-125b and miR-132 had largely opposing effects on dendritic spine morphology and synaptic physiology in hippocampal neurons. FMRP knockdown ameliorates the effect of miRNA overexpression on spine morphology. We identified NMDA receptor subunit NR2A as a target of miR-125b and show that NR2A mRNA is specifically associated with FMRP in brain. In hippocampal neurons, NR2A expression is negatively regulated through its 3' UTR by FMRP, miR-125b, and Argonaute 1. Regulation of NR2A 3'UTR by FMRP depends in part on miR-125b. Because NMDA receptor subunit composition profoundly affects synaptic plasticity, these observations have implications for the pathophysiology of fragile X syndrome, in which plasticity is altered.


Figures

Figure 1
Figure 1. Identification of miRNAs associated with FMRP in brain
(A) FMRP immunoprecipitates from individual wild-type and FMR1 KO mouse brain (age 3 months) were immunoblotted with anti-FMRP antibody. (B) miRNA recovery from FMRP-immunoprecipitation of wild-type mice normalized to FMR1 KO mice. For both groups individual immunoprecipitations derived from six single mice were analyzed by TaqMan qPCR. Statistical analysis by Student’s t-test: * p < 0.05, ** p < 0.01, *** p < 0.001.
Figure 2
Figure 2. Overexpression of FMRP-associated miRNAs differentially affects dendritic spine morphology
(A) Hippocampal neurons at DIV14 were cotransfected with plasmids expressing specific miRNAs (see Supplemental Figure S1A) and EGFP to outline neuron morphology. Three days post-transfection (DIV14+3) neurons were fixed, immunostained for EGFP and imaged by confocal microscopy to visualize dendritic arborization and spine morphology. Low-magnification images show transfected whole neurons, and higher-magnification images show representative dendritic segments of these cells. Scale bars represent 10 µm (upper and lower panels). The length (B), width (C) and density (D) of dendritic protrusions were manually measured using MetaMorph software. Data was normalized to neurons transfected with empty vector (vec). Statistical analysis by one-way ANOVA with Dunnett’s post test: * p < 0.05, ** p < 0.01. n = 26 to 72 neurons each group. (E) Percentage of protrusions with length > 3 µm or length > 5 µm. See also Supplemental Figure S2.
Figure 3
Figure 3. Overexpression of FMRP-associated miRNAs differentially affects dendritic spine morphology
(A) Hippocampal neurons were cotransfected (DIV14+3) with EGFP, miRNAs and shRNAs (compare Supplemental Figure S3). Scale bars represent 10 µm (upper and lower panels). The length (B), width (C) and density (D) of dendritic protrusions were manually quantified. Data was normalized to neurons co-transfected with miR-143 and Luc shRNA. Statistical analysis by one-way ANOVA with Bonferroni’s post test: * p < 0.05, ** p < 0.01. n = 25 to 35 neurons each group.
Figure 4
Figure 4. Sponging of FMRP-associated miRNAs differentially affects dendritic spine morphology
(A) Hippocampal neurons were cotransfected (DIV14+3) with EGFP and sponges for specific miRNAs (see Supplemental Figure S1B, C) to sequester endogenous miRNA. Scale bars represent 10 µm (upper and lower panels). The length (B), width (C) and density (D) of dendritic protrusions was manually quantified. Data was normalized to neurons expressing empty vector (vec). n = 23 to 50 cells each group. Statistical analysis by one-way ANOVA with Dunnett’s post test: * p < 0.05, ** p < 0.01. (E) Sholl analysis of sponge-transfected neurons, measuring the number of dendrites crossing concentric circles at the indicated distance around the cell body. Gray corridor represents neurons transfected with empty vector (mean +/− SEM). n = 40 to 71 neurons each group. Sponge transfected cells are significantly different from control neurons (Two-way ANOVA, p<0.05) for: miR-124 and let-7 (from 37.5 µm radius), miR-125 and miR-132 (from 63.5 µm), miR-22 and miR-143 (from 75 µm).
Figure 5
Figure 5. miR-125b and miR-132 modify synaptic strength
AMPA-mediated miniature excitatory postsynaptic currents (mEPSCs) measured in cultured hippocampal neurons cotransfected (DIV14+3) with EGFP and miR-125b (A, C) or miR-132 (B, D) overexpression or sponge constructs. (A, B) Representative mEPSC traces from transfected neurons. (C, D) Mean mEPSC amplitude and frequency normalized to control neurons transfected with empty vector. Statistical analysis using Kruskal-Wallis test and Dunn’s post test: ** p < 0.01, *** p < 0.001. n = 16 to 22 neurons for each group.
Figure 6
Figure 6. NR2A 3’UTR is regulated by miR-125b
FF-luc 3’UTR reporters for NMDA receptor subunits NR1, NR2A or N2B were cotransfected with miRNA overexpressing or sponging constructs, as well as RR-luc. Relative expression was determined by normalizing the ratio of FF-luc and RR-luc activity to the effect of each miRNA on a control FF-luc reporter (and let-7c). (A) Alignment of the 3’UTR sequence of NR2A in four mammalian species with miR-125b. (B) Relative expression of NMDA receptor FF-luc reporters constructs cotransfected with miRNA-expressing constructs in HEK293 cells. n =18 to 24. One-way ANOVA with Dunnett’s post test: * p < 0.05, ** p < 0.01. n = 12 to 54. See Supplemental Figure S4 and S5. (C) Relative expression of FF-luc reporters cotransfected with miRNA-sponges in hippocampal neurons (DIV4+3). NR2A Δ125 completely lacks the miRNA-target site shown above. Two-way ANOVA with Bonferroni’s post test: ** p < 0.01, *** p < 0.001. n = 14 to 56.
Figure 7
Figure 7. NR2A is a miR-125b target in neurons
(A) Cultured hippocampal neurons (DIV4+4) were infected with miR-143 (−) or 125b (+) overexpressing or sponging viral vectors. Immunoblots show NMDA receptor subunits expression. Immunoblot signals were quantified by densitometry and normalized to total protein amounts and miR-143 expressing controls. Student’s t-test: ** p < 0.01. *** p < 0.001. n = 6. (B) NMDA-receptor EPSC half-width measured in CA1 pyramidal cells in organotypic hippocampal slice culture transfected with miR-143 (ctrl), miR-125b alone (with empty vector), miR-125b together with NR2A or miR-125b sponge (DIV11+4). Paired recording of transfected and untransfected neighboring neurons in the same slice, labeled + and − respectively. Paired Student’s t-test: * p < 0.05. n = 12 to 14 pairs.
Figure 8
Figure 8. miRNA target genes associate with FMRP in mouse brain
(A) Enrichment of specific mRNAs in FMRP-immunoprecipitates from wild-type mouse brain extracts relative to those derived from FMR1 KO mice (age 3 months) measured by RT-qPCR. RNA-samples are identical to those used in Figure 1. Statistical analysis by Student’s t-test: ** p < 0.01, ** p < 0.001. n = 6 immunoprecipitations from individual mice each group. (B) Enrichment of rat mRNAs in FMRP-immunoprecipitates from wild-type rat brain mixed with FMR1 KO mouse brain during homogenization.indicates in vivo interaction of FMRP with specific mRNAs (see text). Statistical analysis using Fisher’s exact test ** p < 0.01, *** p < 0.001. n = 29 to 45. Dashed line indicates the frequency (~17%) of rat cDNAs in the input material averaged among all tested genes. See also Supplemental Figure S7. (C, D) Hippocampal neurons (DIV4+3) were cotransfected with FF-luc 3’UTR reporters for the indicated NMDA receptor subunits as well as RR-luc and shRNA constructs targeting ZnT3, FMRP, AGO1 or EGFP (see Supplemental Figure S3). Graphs indicate expression of the reporter constructs normalized to the effect of each shRNA on a control FF-luc construct. Statistical analysis: (C) One-way ANOVA with Dunnett’s post test: * p < 0.05, ** p < 0.01. n = 24 to 72. (D) Student’s test comparing the response of both NR2A reporter variants: * p < 0.05, ** p < 0.01, *** p < 0.001. n = 18. See also Supplemental Figures S6, S7 and S8.

References

    1. Alvarez VA, Ridenour DA, Sabatini BL. Distinct structural and ionotropic roles of NMDA receptors in controlling spine and synapse stability. J Neurosci. 2007;27:7365–7376. - PMC - PubMed
    1. Antar LN, Afroz R, Dictenberg JB, Carroll RC, Bassell GJ. Metabotropic glutamate receptor activation regulates fragile x mental retardation protein and FMR1 mRNA localization differentially in dendrites and at synapses. J Neurosci. 2004;24:2648–2655. - PMC - PubMed
    1. Bagni C, Greenough WT. From mRNP trafficking to spine dysmorphogenesis: the roots of fragile X syndrome. Nat Rev Neurosci. 2005;6:376–387. - PubMed
    1. Barria A, Malinow R. NMDA receptor subunit composition controls synaptic plasticity by regulating binding to CaMKII. Neuron. 2005;48:289–301. - PubMed
    1. Bassell GJ, Warren ST. Fragile X syndrome: loss of local mRNA regulation alters synaptic development and function. Neuron. 2008;60:201–214. - PMC - PubMed

Publication types

MeSH terms