. 2010 Feb 11;65(3):399-411.
doi: 10.1016/j.neuron.2010.01.009.

Synaptic inhibition in the olfactory bulb accelerates odor discrimination in mice

Affiliations

Synaptic inhibition in the olfactory bulb accelerates odor discrimination in mice

Nixon M Abraham et al. Neuron. .

Abstract

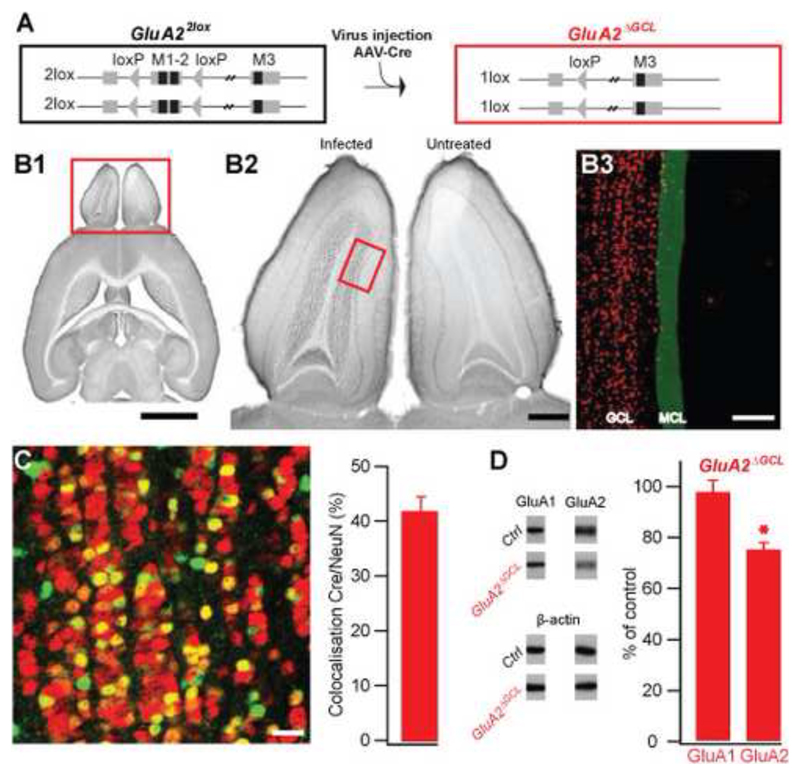
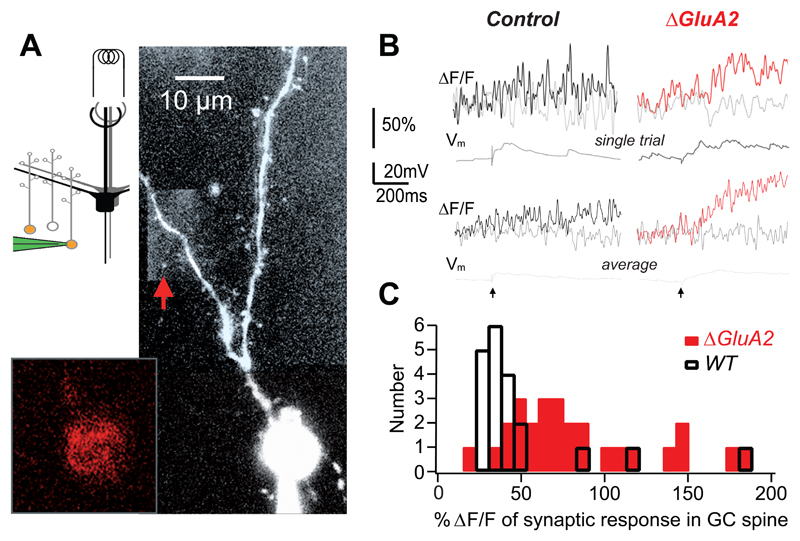
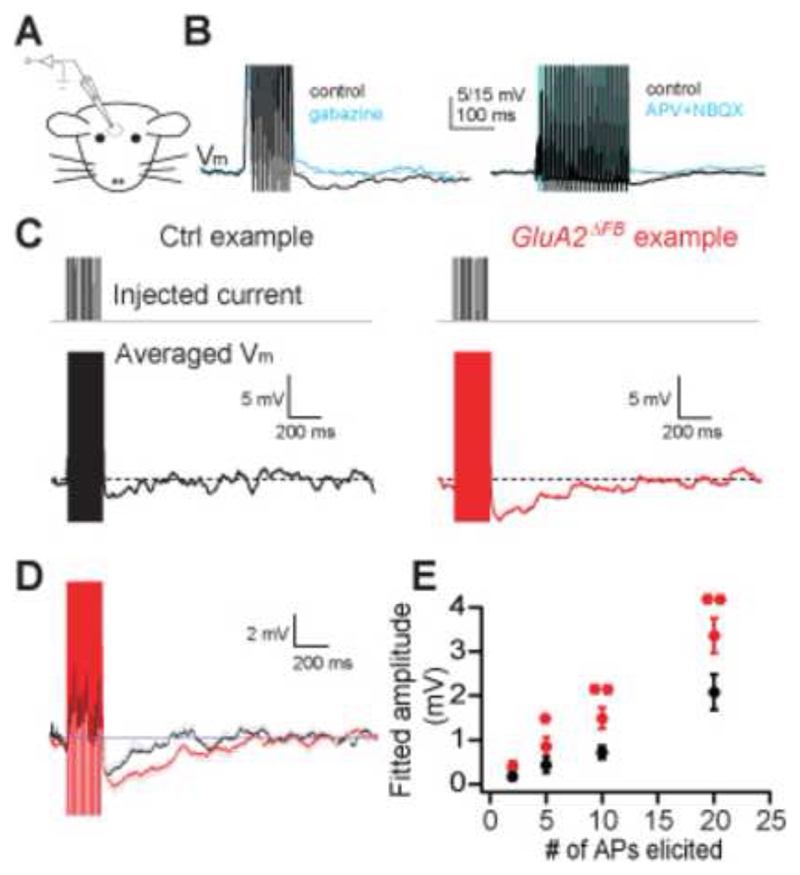
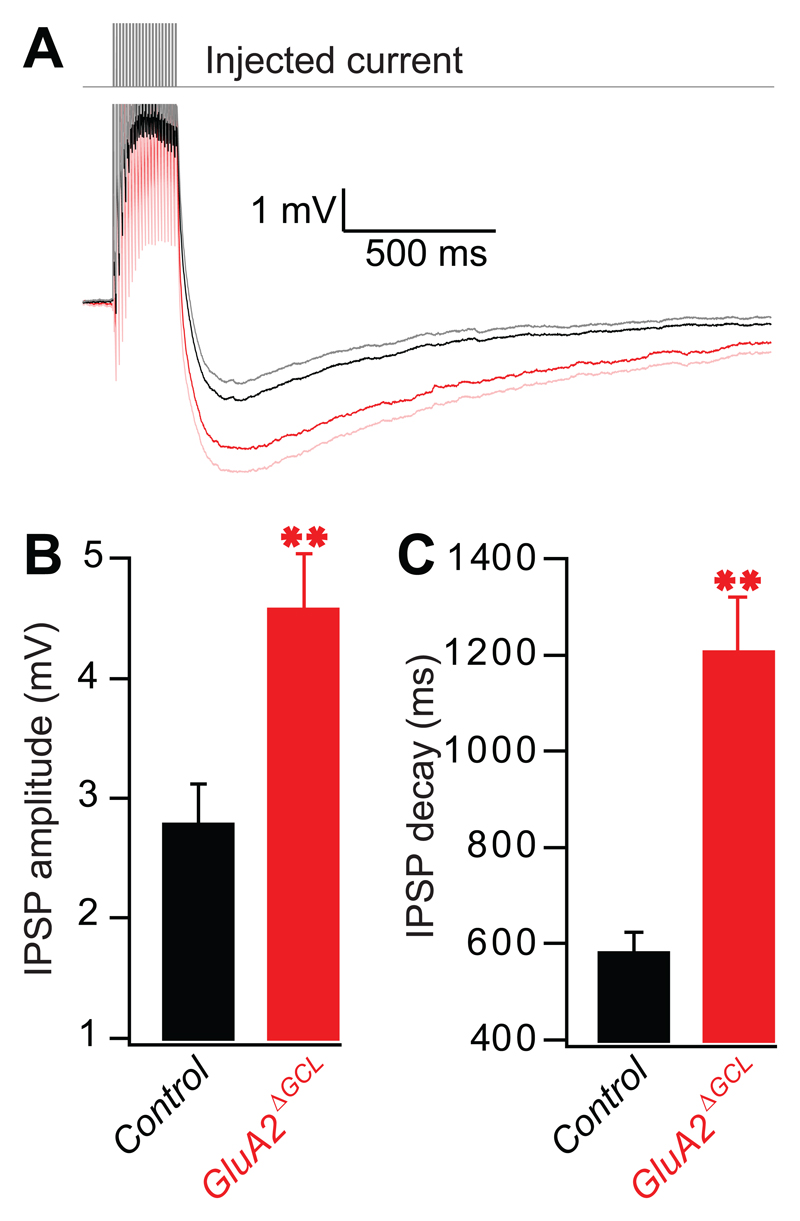
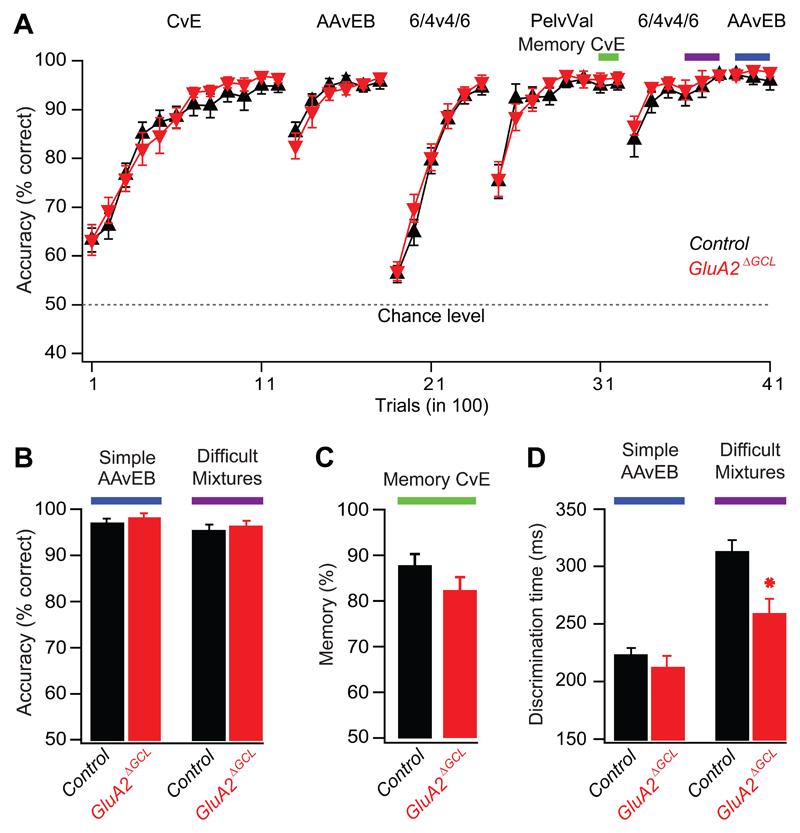
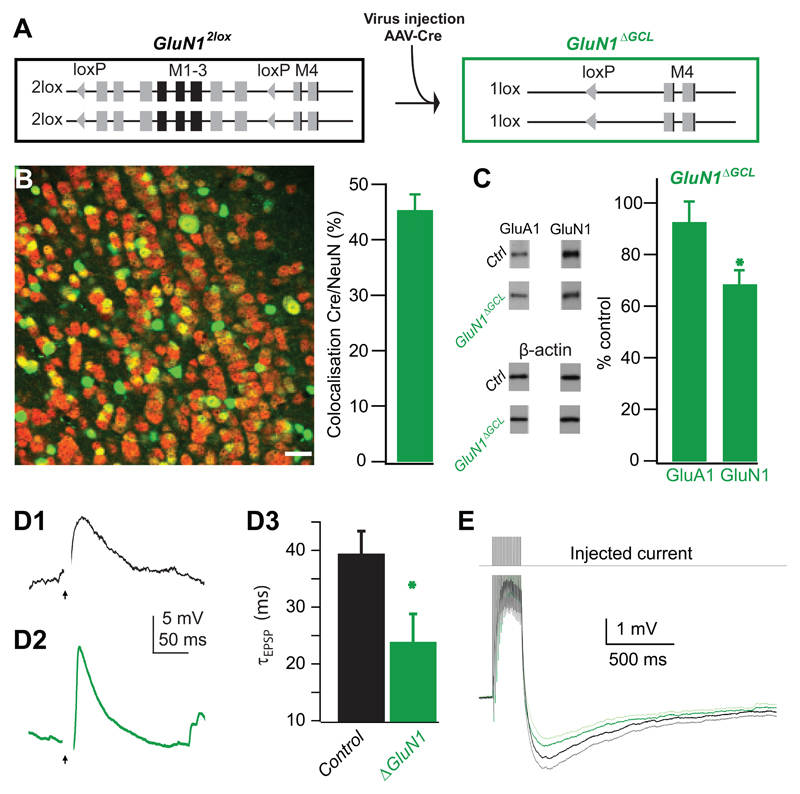
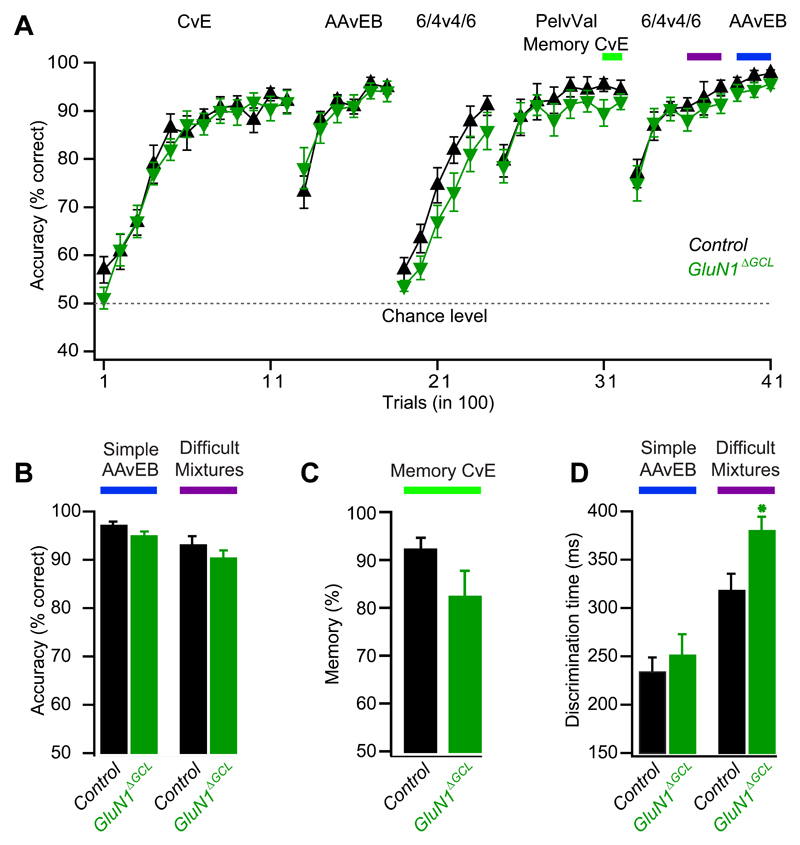
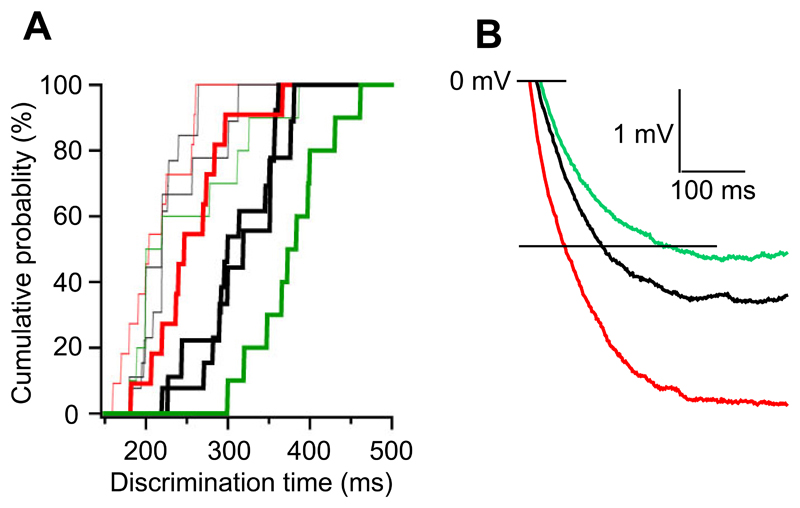
Local inhibitory circuits are thought to shape neuronal information processing in the central nervous system, but it remains unclear how specific properties of inhibitory neuronal interactions translate into behavioral performance. In the olfactory bulb, inhibition of mitral/tufted cells via granule cells may contribute to odor discrimination behavior by refining neuronal representations of odors. Here we show that selective deletion of the AMPA receptor subunit GluA2 in granule cells boosted synaptic Ca(2+) influx, increasing inhibition of mitral cells. On a behavioral level, discrimination of similar odor mixtures was accelerated while leaving learning and memory unaffected. In contrast, selective removal of NMDA receptors in granule cells slowed discrimination of similar odors. Our results demonstrate that inhibition of mitral cells controlled by granule cell glutamate receptors results in fast and accurate discrimination of similar odors. Thus, spatiotemporally defined molecular perturbations of olfactory bulb granule cells directly link stimulus similarity, neuronal processing time, and discrimination behavior to synaptic inhibition.


Figures

Figure 1
Figure 1. OB-specific GluA2 deletion.
A. Cre-mediated ablation of loxP-flanked transmembrane regions 1 and 2 of the GluA2 gene (M1-2, Exon 11, GluA22lox) by AAV-mediated Cre-expression in the GC layer of the OB (GluA2ΔGCL). B. Specific AAV-mediated expression of Cre recombinase in the granule cell layer (GCL) of the left OB. B1, immuno-detection of Cre recombinase in the OB in comparison to the whole brain (DAB-stained transverse section). Scale bar 2.5 mm. B2, Cre expression in the left OB compared with a non-injected right side. Scale bar 0.5 mm. B3, Illustration of localization of Cre-positive cells (red) in the GCL relative to the mitral cell layer (MCL, green). Cre-positive cells were derived by tresholding and MCL position was drawn manually. Scale bar 100 μm. Box in B1 indicates localization of higher magnification in B2, box in B2 shows an example for localization of image shown in B3. C. Immunofluorescence overlay showing colocalization of Cre (green) and NeuN (red) in the GCL. Neurons expressing Cre appear in tones of yellow and orange, neurons not expressing Cre are red, and non-neuronal cells expressing Cre are green. Fraction of GCs expressing Cre: 42 ± 3 % (mean±SEM, n=14 samples, taken from 7 AAV-Cre infected mice). Because GCs undergo constant turnover, the fraction of infected cells is likely to be higher at the beginning of the experiment. Scale bar 20 μm. D. Immunoblots of AAV-Cre infected (n=7) and non-infected (n=7) whole OB protein detecting GluA1 and GluA2, with β-actin as a loading control. GluA1 levels were unchanged compared to control (97±5%, mean ± SEM, n=39 samples, p=0.6), while the amount of GluA2 protein was significantly reduced (74±8%, mean±SEM, n=103 samples, p<0.001, student-t test).
Figure 2
Figure 2. Increased Ca2+ inflow into granule cells lacking GluA2
A. Scheme showing recording configuration (red-filled GCs represent virally labeled GC, patch pipette (green), mitral cells (black/grey) and electrical stimulation at GL). Image shows GC of a P36 GluA2ΔGCL mouse imaged with two-photon microscopy. In this case, AAV-Cre-2A-Kusabira Orange was used to express Cre recombinase and Kusabira Orange simultaneously, facilitating targeted patch-clamp recordings from GCs lacking GluA2. Granule cells were filled with 100 μM OGB-1 (signal in large panel) after identification of Kusabira Orange expression in the soma (inset, red). B. Top panel: Individual synaptic fluorescence transients (ΔF/F) recorded from the spine (thick trace) and its adjacent dendrite (grey trace) marked by a red arrow in A. Corresponding voltage traces shown directly beneath. Lower panel: Averaged fluorescence and voltage signals (n=3 (cntrl), n=13 (ΔGluA2)). Stimulation artifact marked at the bottom. C. Histograms of the amplitudes of individual synaptic responses in mouse GCs with unperturbed GluA2 (black; n = 20 events) and GluA2 deletion (red; n = 27 events).
Figure 3
Figure 3. GluA2 deletion results in increased recurrent inhibition in vivo
A. Scheme of in vivo patch-clamp recordings from mitral cells in the OB. B. Examples of in vivo patch-clamp recordings from mitral cells and stimulus paradigms used. Recurrent IPSPs were evoked by eliciting 10 or 20 APs and were blocked by application of blockers of GABAergic (500 μM Gabazine, left) or glutamatergic (500 μM APV and 500 μM NBQX, right) synaptic transmission. C. Examples of in vivo patch-clamp recordings from a mitral cell in control (left) and GluA2ΔFB (right) mice. 20 APs were evoked and traces were averaged as described in the supplementary information. D. Averaged recurrent IPSP traces from n=9 cells (control) and n=15 cells (GluA2ΔFB) recorded from as shown in B. Gray lines indicate SEM between cells. E. IPSP amplitude is proportional to stimulus strength and stronger in mitral cells of GluA2ΔFB mice (**p<0.005, * p<0.05, 1-tailed t-test).
Figure 4
Figure 4. GluA2 deletion results in increased recurrent inhibition in vitro
A. Responses of mitral cells in OB slices from control (black) and GluA2ΔGCL (red) elicited by 20 APs. Averaged traces of 11 control cells (C57BL6 and GluA2 littermate controls) and 13 GluA2ΔGCL cells are shown with the SEM shown as grey and pink traces, respectively. B. Peak amplitudes of IPSPs (mean±SEM). The peak amplitude was determined within a 500 ms time window in each individual trace resulting in a higher mean as shown in A (2.76±0.35 mV, n=11 cells [C57BL6 and GluA2 littermate controls], 4.55±0.48 mV, n=13 cells [GluA2ΔGCL], p<0.01, Mann-Whitney). C. Decay time constants of IPSPs (mean±SEM): 575±47 ms, n=11 cells [C57BL6 and GluA2 littermate controls], 1199±120 ms, n=13 cells [GluA2ΔGCL], p=<0.0001, t-test.
Figure 5
Figure 5. OB-specific GluA2 deletion accelerates discrimination of similar odors and does not affect learning and memory
A. Accuracy shown as the percentage of correct choices for simple odor pairs (each 1% in mineral oil): cineol (C), eugenol (E), amyl acetate (AA), ethyl butyrate (EB), pelargonic acid (Pel), valeric acid (Val). Difficult mixture: 0.4% AA/0.6% EB versus 0.6% AA/0.4% EB. Colored bars depict trials taken for quantitative analyses in panels B to D. Learning performance was indistinguishable between the groups (ANOVA, F = 0.85, p = 0.4). B. Accuracy (mean ± SEM). No difference was observed in performance levels of GluA2ΔGCL (98±1%, n=11) and control mice (97±1%, n=13) for simple odors (p=0.4, Mann-Whitney) and similar odor mixtures (GluA2ΔGCL 96±2%, n=11, control mice, 95±2%, n=13 p=0.5, Mann-Whitney). The two groups of control mice were pooled. C. Memory (mean ± SEM) after two weeks for cineol versus eugenol in GluA2ΔGCL (red bar, n=11) and control (black bar, n=13) mice was indistinguishable (p=0.3, student-t test). D. Discrimination time (mean ± SEM). GluA2ΔGCL (211.7±10.9 ms, n=11) and control mice (222.5±6.8 ms, n=13) did not differ significantly for simple odors (p=0.4, student-t test), but discrimination time was substantially reduced for similar odor mixtures when comparing GluA2ΔGCL (257.1±15.2 ms, n=11) with control mice (311.1±11.8 ms, n=13 p<0.01, student-t test).
Figure 6
Figure 6. OB-specific GluN1 deletion
A. AAV-Cre-mediated ablation of loxP-flanked transmembrane regions 1, 2 and 3 of the GluN1 gene (M1-3, Exons 11-18, GluN12lox) by AAV-mediated Cre-expression in the granule layer of the OB (GluN1ΔGCL). B. Immunofluorescence detection of Cre in the OB (see also legend to Figure 1C). The fraction of GCs expressing Cre was 45 ± 3 % (mean±SEM, n=9 samples, taken from 2 AAV-Cre infected mice). Scale bar 20 μm. C. Quantification of immunoblots of AAV-Cre infected (n=2) and non-infected (n=6) whole OB protein detecting GluA1, GluN1 and β-actin. GluA1 levels were unchanged compared to control (92±8%, mean±SEM, n=11 samples p=0.3), while the amount of GluN1 protein was significantly reduced (68±6%, mean±SEM, n=22 samples, p<0.001, student-t test). D. In vitro whole-cell recording of evoked EPSPs in uninfected GC (D1) and GC with GluN1-deletion (D2). Time of glomerular stimulation marked by arrowhead; stimulus artifact is blanked; membrane potential approximately -80 mV, see text for details). (D3) Quantification of decay kinetics (values see main text). E. Responses of mitral cells in OB slices from control (black) and GluN1ΔGCL (green) elicited by 20 APs. Averaged traces of 11 control cells (C57BL6 and GluA2 littermate controls) and 14 GluN1ΔGCL cells are shown with the SEM shown as grey and light green traces, respectively.
Figure 7
Figure 7. OB-specific GluN1 deletion slows discrimination of similar odors and does not affect learning and memory
A. Learning curves as in Fig. 5A. B. Accuracy shown as the percentage of correct choices (mean ± SEM). No difference observed in performance levels of GluN1ΔGCL (94.6±1%, n=10) and control mice (96.8±1%, n=9) for simple odors (p=0.2, student-t test) and similar odor mixtures (GluN1ΔGCL (90±1.8%, n=10, Control mice, 92.7±2.1%, n=9, p=0.4, student-t test). C. Memory (mean ± SEM) after two weeks for cineol versus eugenol in GluN1ΔGCL mice (red bar, n=10) and control (black bar, n=9) mice was not significantly different (p=0.1, student-t test). D. Discrimination time (mean ± SEM). GluN1ΔGCL (249.3±22.6 ms, n=10) and control mice (232.1±15.9 ms, n=9) did not differ significantly for simple odors (p=0.5, student-t test), but discrimination time was significantly increased for similar odor mixtures when comparing GluN1ΔGCL (378.3±15.4 ms, n=10) with control mice (316.2±18.4 ms, n=9, p<0.05, student-t test).
Figure 8
Figure 8. Bidirectional shifts of odor discrimination time
A. Cumulative probabilities of odor discrimination times for simple odors (thin lines) and mixtures (thick lines). Discrimination times determined for controls (black, both from Fig. 5 and Fig. 7), GluA2ΔGCL (red) and GluN1ΔGCL (green) mice. B. Dendrodendritic inhibition. Averaged traces of control (black), GluA2ΔGCL (red) and GluN1ΔGCL (green) shown in Figs. 4A and 7E1.

Comment in

Similar articles

Cited by

References

    1. Abraham NM, Spors H, Carleton A, Margrie TW, Kuner T, Schaefer AT. Maintaining accuracy at the expense of speed: stimulus similarity defines odor discrimination time in mice. Neuron. 2004;44:865–876. - PubMed
    1. Aungst JL, Heyward PM, Puche AC, Karnup SV, Hayar A, Szabo G, Shipley MT. Centre-surround inhibition among olfactory bulb glomeruli. Nature. 2003;426:623–629. - PubMed
    1. Balu R, Pressler RT, Strowbridge BW. Multiple modes of synaptic excitation of olfactory bulb granule cells. J Neurosci. 2007;27:5621–5632. - PMC - PubMed
    1. Brusa R, Zimmermann F, Koh DS, Feldmeyer D, Gass P, Seeburg PH, Sprengel R. Early-onset epilepsy and postnatal lethality associated with an editing-deficient GluR-B allele in mice. Science. 1995;270:1677–1680. - PubMed
    1. Chavez AE, Singer JH, Diamond JS. Fast neurotransmitter release triggered by Ca influx through AMPA-type glutamate receptors. Nature. 2006;443:705–708. - PubMed

Publication types

MeSH terms