. 2010 Feb 11;65(3):412-21.
doi: 10.1016/j.neuron.2010.01.020.

Nonoverlapping sets of synapses drive on responses and off responses in auditory cortex

Affiliations

Nonoverlapping sets of synapses drive on responses and off responses in auditory cortex

Ben Scholl et al. Neuron. .

Abstract

Neurons in visual, somatosensory, and auditory cortex can respond to the termination as well as the onset of a sensory stimulus. In auditory cortex, these off responses may underlie the ability of the auditory system to use sound offsets as cues for perceptual grouping. Off responses have been widely proposed to arise from postinhibitory rebound, but this hypothesis has never been directly tested. We used in vivo whole-cell recordings to measure the synaptic inhibition evoked by sound onset. We find that inhibition is invariably transient, indicating that off responses are not caused by postinhibitory rebound in auditory cortical neurons. Instead, on and off responses appear to be driven by distinct sets of synapses, because they have distinct frequency tuning and different excitatory-inhibitory balance. Furthermore, an on-on sequence causes complete forward suppression, whereas an off-on sequence causes no suppression at all. We conclude that on and off responses are driven by largely nonoverlapping sets of synaptic inputs.


Figures

Figure 1
Figure 1. Three Hypotheses for the Synaptic Mechanisms underlying On and Off Responses in Auditory Cortical Neurons
In each case, spiking on and off responses (black traces) are produced in the black neuron by inputs from excitatory (green) or inhibitory (red) presynaptic neurons. The gray horizontal bars indicate sound stimuli. (A) On and off responses are driven by the same sets of synapses. Only excitatory synaptic inputs are shown (inhibition would be identical to excitation). (B) Off responses are generated by a rebound from sustained synaptic inhibition. (C) On and off responses are each driven by different presynaptic neurons. Only excitatory synaptic inputs are shown (inhibition would be identical to excitation).
Figure 2
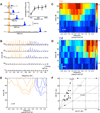
Figure 2. Off Responses Are Tuned One to Two Octaves above On Responses
(A) Example of single-unit responses to a 40 kHz, 80 dB SPL tone at five different durations. Colors indicate 100 ms windows following tone onset (orange) and offset (blue). Bar underneath each histogram indicates tone presentation. (Inset) Off response magnitude as a function of tone duration, averaged across five neurons. Responses are normalized to the mean on response for each tone. (B) Responses of a different neuron to a wide range of tone frequencies (1–40 kHz) and levels (0–80 dB), all with duration 400 ms. CF for this site was 4.1 kHz. Note that off responses (blue) were evoked at higher frequencies than on responses (orange). (C) On responses to the same tone array, averaged across 18 neurons. Responses are spike counts in a 100 ms window following tone onset (i.e., orange regions in A and B), aligned to CF and normalized to the maximal on response for each neuron. Note that CF is defined by on responses here and in all figures except Figure 2F. (D) Off responses (spike counts in a 100 ms window following tone offset, i.e., blue regions in A and B) for the same neurons, aligned to CF and normalized to the maximal on response for each neuron. (E) Contour plots for the population on responses in (C) (orange) and the population off responses in (D) (blue). Contours indicate 85th, 90th, and 95th percentiles. (F) Comparison of CF for on responses (On CF) to that for off responses (Off CF) for each neuron (n = 18).
Figure 3
Figure 3. Balance of Excitation to Inhibition Typically Differs for On and Off Responses
(A) Example of tone-evoked synaptic currents recorded at three different holding potentials. The gray bar indicates the tone (400 ms, 19.8 kHz, 80 dB SPL). Holding potential is indicated by trace color. Note that at +12 mV (magenta) outward currents are transient and not sustained throughout the tone. Note also that at −88 mV (dark blue) inward currents are evoked for both the on response and off response, whereas at +12 mV (magenta) outward currents are evoked only for the on response but not for the off response. (B) Excitatory (green) and inhibitory (red) synaptic conductances calculated from the currents in (A). Note that the on response is transient and consists of both excitation and inhibition, but the off response consists of pure excitation. (C) Excitatory and inhibitory conductances for the same cell, tone frequency, and level as in (A) and (B), for five different tone durations. Note the purely excitatory off responses. (D) Example (from a different cell) of a nearly pure excitatory on response, but an off response with equal magnitudes of excitation and inhibition. Note that this is the reverse of the example in (A)–(C). Tone was 400 ms, 23.6 kHz, 80 dB SPL. (E) Example (from a different cell) of a tone that evoked no on response but an off response with roughly equal magnitudes of excitation and inhibition. Tone was 400 ms, 33.6 kHz, 80 dB SPL. (F) Example from a different cell showing a tone that evoked both an on response and an off response with roughly equal magnitudes of excitation and inhibition. Tone was 400 ms, 25.5 kHz, 80 dB SPL. (G) E/I ratio for on and off responses across the population (n = 25 cells). Each dot (n = 217) represents the trial-averaged response to a tone 400 ms or longer. Only responses with both strong on and off responses were included (total synaptic conductance >1 nS for both). The ratio of peak excitatory conductance to peak inhibitory conductance for the off response (E/I OFF) is plotted against that for the on response for that tone (E/I ON). The E/I ratios for on and off responses were uncorrelated (r = 0.04, p = 0.53). Subpanels show E/I distributions separately for on and off responses.
Figure 4
Figure 4. Forward Suppression Does Not Account for the Different E/I Balance of Off Responses
(A) Example of synaptic currents from a neuron that showed pure excitation for the second of a pair of clicks, for short click separation. Holding potential is indicated by trace color, the gray bars indicate the clicks (10 ms, 80 dB SPL white noise bursts). Note that for a click separation of 100 ms inward currents were evoked by both clicks at −99 mV (dark blue), whereas at −9 mV (magenta) outward currents were evoked only for the first but not for the second click. At longer click separations outward currents were evoked by both clicks. (B) Excitatory (green) and inhibitory (red) synaptic conductances calculated from the currents in (A). Note the purely excitatory response to the second click for a separation of 100 ms. (C and D) Example of a neuron that showed balanced excitation and inhibition for both clicks in a pair, for any click separation (C), but unbalanced off responses for any tone duration (D). (E and F) Example of a neuron that showed pure excitation for the second of a pair of clicks, only for short click separation (E), but purely excitatory on responses for any tone duration (F). The off response is very small and purely excitatory for a 100 ms tone, perhaps due to forward suppression, but off responses show balanced excitation and inhibition at longer durations.
Figure 5
Figure 5. Both Unbalanced On and Off Responses Can Be Explained by Pure Excitation at the Edges of the Receptive Field
Synaptic tuning curve for an example neuron, with peak excitatory (green) and inhibitory (red) conductances plotted as a function of tone frequency. On responses are shown by solid lines, off responses are shown by dashed lines. (Insets) Synaptic conductance traces at five representative frequencies within the receptive field, indicated by open circles in the synaptic tuning curve. On responses show roughly balanced excitation and inhibition at 4.1 kHz, within the core of the on receptive field, but show nearly pure excitation at 1.7 and 13.9 kHz, at the edges of the on receptive field. Off responses show roughly balanced excitation and inhibition at 33.6 kHz, within the core of the off receptive field, but show nearly pure excitation at 13.9 and 28.2 kHz, at the edges of the off receptive field. Tones were 80 dB SPL.
Figure 6
Figure 6. Both Unbalanced On and Off Responses Can Be Explained by Pure Excitation at the Edges of the Receptive Field (Group Data)
(A and B) Synaptic tuning curves for on responses (A) and off responses (B) averaged across 13 neurons, with normalized peak excitatory (green) and inhibitory (red) conductances plotted as a function of tone frequency (aligned to CF for each neuron, where CF is defined by on responses). Shaded regions indicate SEM. Note the nearly pure excitation at the edges of the receptive fields for both on and off responses. (C and D) E/I ratio for on responses (C) and off responses (D) across the population (n = 13 cells). Each dot represents the trial-averaged response to a tone 400 ms or longer. Only responses with both strong on and off responses were included (total synaptic conductance >1 nS for both). The ratio of peak excitatory conductance to peak inhibitory conductance is plotted against frequency (the absolute value of the distance from CF). Tones were 80 dB SPL for (A)–(D).
Figure 7
Figure 7. Off Responses Do Not Cause Forward Suppression of On Responses
(A) Example of single-unit spiking responses to tone pairs (19.8 kHz, 80 dB). This tone frequency was chosen such that the on response to a 25 ms tone (magenta) was equivalent to the off response to a 400 ms tone (black). Note that the on response to the first 25 ms tone (magenta) caused complete forward suppression of the response to the second 25 ms tone (arrow). In contrast, the off response to the 400 ms tone (black) caused no suppression of the on response to the second 400 ms tone (arrow). Separation was 100 ms between onsets for 25 ms tones (magenta) and between offset and onset for 400 ms tones (black). Means of 40 trials. (B) Single-unit responses as in (A) averaged across 33 neurons for which on responses to the 25 ms tone were equivalent to the off responses to the 400 ms tone. On responses invariably suppressed on responses to tones at a separation of 100 ms, but off responses caused no suppression of on responses to tones at a separation of 100 ms.

Similar articles

Cited by

References

    1. Bregman AS. Auditory Scene Analysis: The Perceptual Organization of Sound. Cambridge, MA: MIT Press; 1990.
    1. Bregman AS, Ahad PA, Kim J. Resetting the pitch-analysis system. 2. Role of sudden onsets and offsets in the perception of individual components in a cluster of overlapping tones. J. Acoust. Soc. Am. 1994;96:2694–2703. - PubMed
    1. Brugge JF, Merzenich MM. Responses of neurons in auditory cortex of the macaque monkey to monaural and binaural stimulation. J. Neurophysiol. 1973;36:1138–1158. - PubMed
    1. Calford MB. The parcellation of the medial geniculate body of the cat defined by the auditory response properties of single units. J. Neurosci. 1983;3:2350–2364. - PMC - PubMed
    1. Calford MB, Webster WR. Auditory representation within principal division of cat medial geniculate body: an electrophysiology study. J. Neurophysiol. 1981;45:1013–1028. - PubMed

MeSH terms