

Crystal structure of the p53 core domain bound to a full consensus site as a self-assembled tetramer
- PMID: 20159469
- PMCID: PMC2824536
- DOI: 10.1016/j.str.2009.11.011
Crystal structure of the p53 core domain bound to a full consensus site as a self-assembled tetramer
Abstract
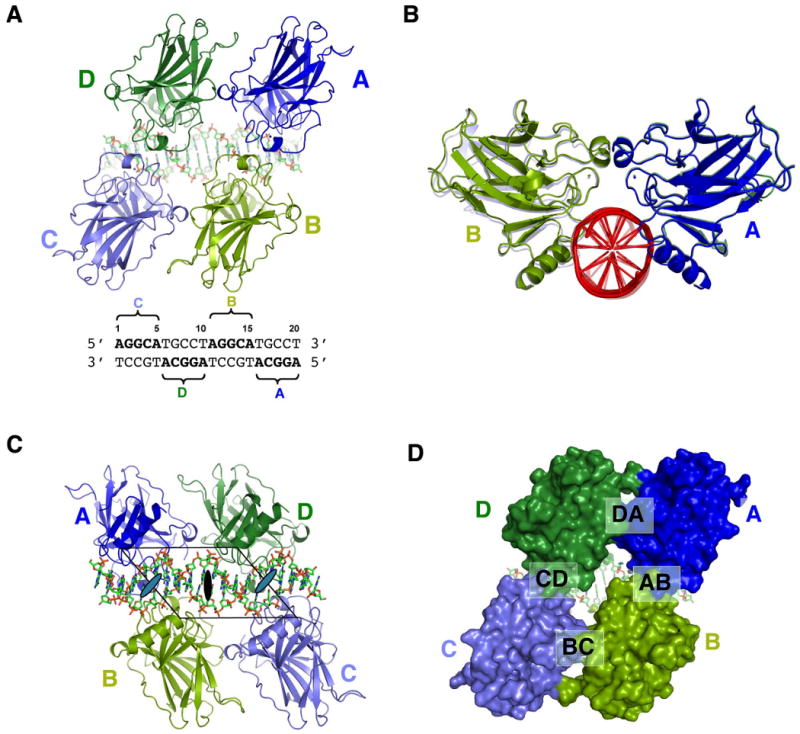
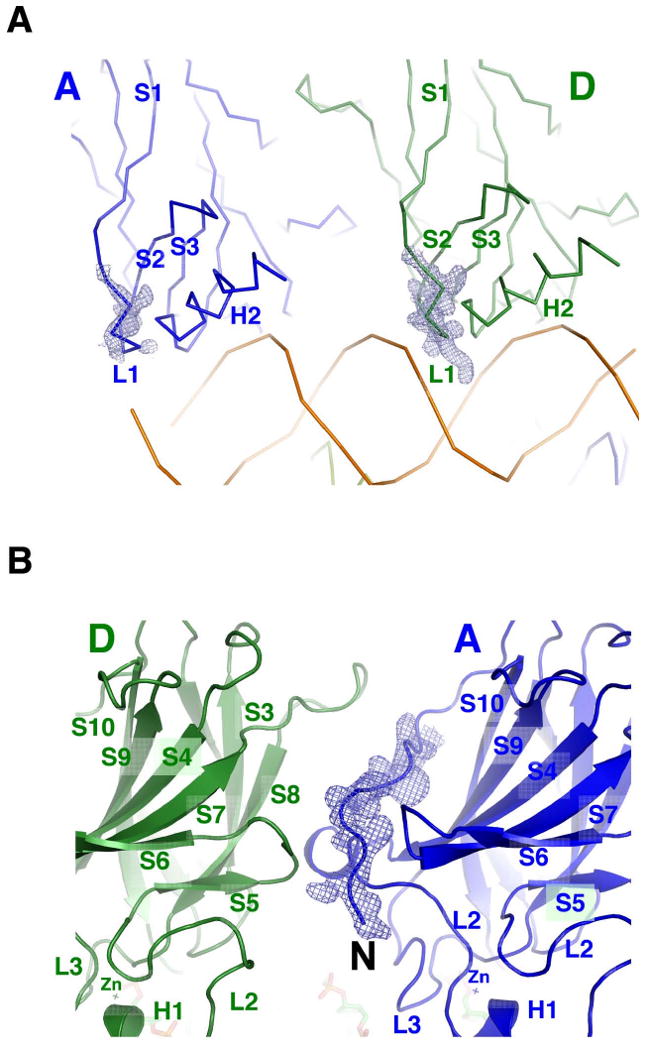
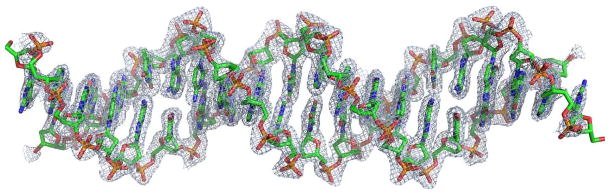
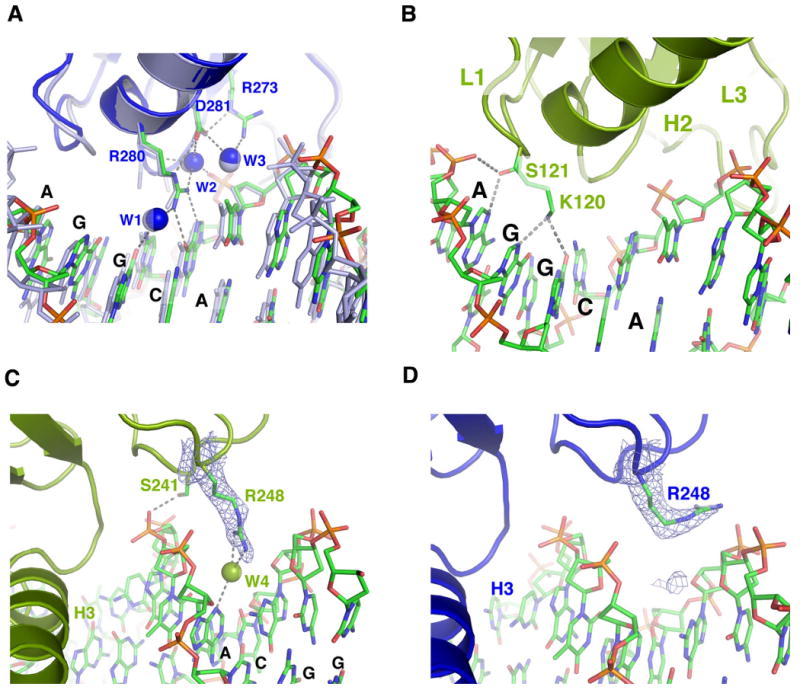
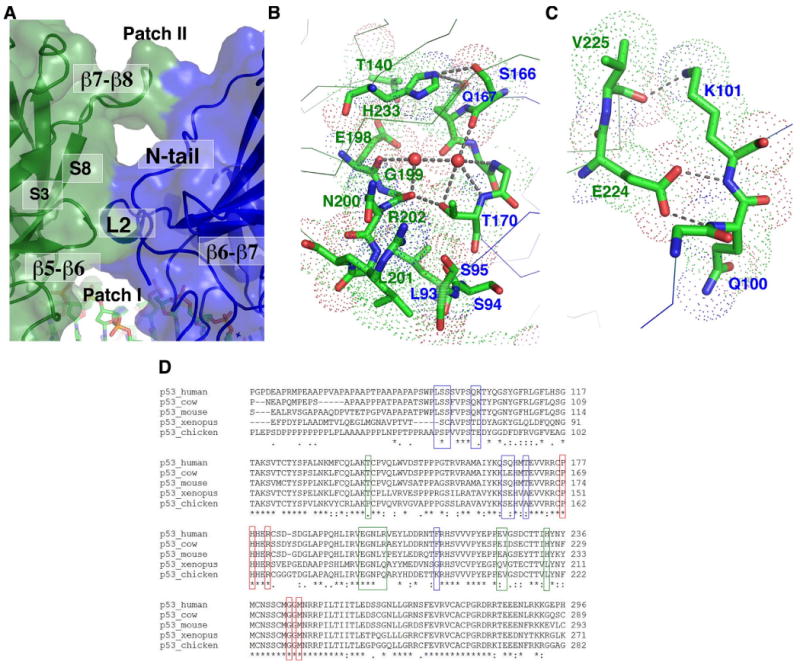
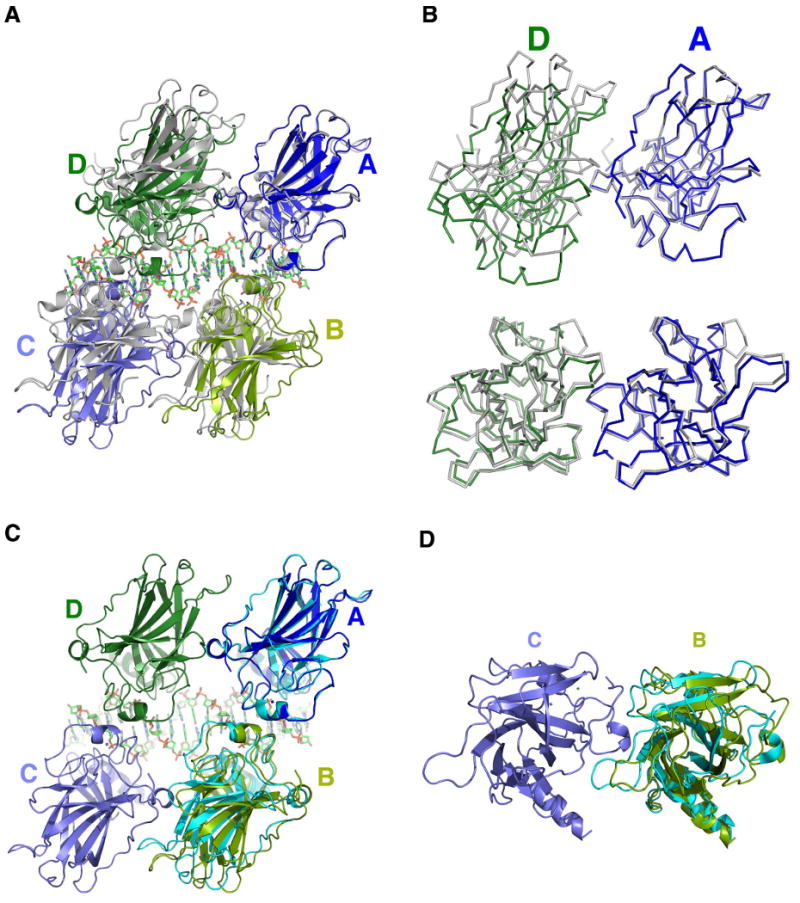
Recent studies suggest that p53 binds predominantly to consensus sites composed of two decameric half-sites with zero spacing in vivo. Here we report the crystal structure of the p53 core domain bound to a full consensus site as a tetramer at 2.13A resolution. Comparison with previously reported structures of p53 dimer:DNA complexes and a chemically trapped p53 tetramer:DNA complex reveals that DNA binding by the p53 core domain is a cooperative self-assembling process accompanied by structural changes of the p53 dimer and DNA. Each p53 monomer interacts with its two neighboring subunits through two different protein-protein interfaces. The DNA is largely B-form and shows no discernible bend, but the central base-pairs between the two half-sites display a significant slide. The extensive protein-protein and protein-DNA interactions explain the high cooperativity and kinetic stability of p53 binding to contiguous decameric sites and the conservation of such binding-site configuration in vivo.
Copyright 2010 Elsevier Ltd. All rights reserved.
Figures
Similar articles
-
Structural basis of DNA recognition by p53 tetramers.Mol Cell. 2006 Jun 23;22(6):741-753. doi: 10.1016/j.molcel.2006.05.015. Mol Cell. 2006. PMID: 16793544
-
NMR spectroscopy reveals the solution dimerization interface of p53 core domains bound to their consensus DNA.J Biol Chem. 2001 Dec 28;276(52):49020-7. doi: 10.1074/jbc.M107516200. Epub 2001 Oct 17. J Biol Chem. 2001. PMID: 11606582
-
The p53 tetramer shows an induced-fit interaction of the C-terminal domain with the DNA-binding domain.Oncogene. 2016 Jun 23;35(25):3272-81. doi: 10.1038/onc.2015.388. Epub 2015 Oct 19. Oncogene. 2016. PMID: 26477317 Free PMC article.
-
The Rich World of p53 DNA Binding Targets: The Role of DNA Structure.Int J Mol Sci. 2019 Nov 9;20(22):5605. doi: 10.3390/ijms20225605. Int J Mol Sci. 2019. PMID: 31717504 Free PMC article. Review.
-
Structural biology of the p53 tumour suppressor.Curr Opin Struct Biol. 2009 Apr;19(2):197-202. doi: 10.1016/j.sbi.2009.02.003. Epub 2009 Mar 13. Curr Opin Struct Biol. 2009. PMID: 19286366 Review.
Cited by
-
Relevance of Amorphous and Amyloid-Like Aggregates of the p53 Core Domain to Loss of its DNA-Binding Activity.Front Mol Biosci. 2022 Apr 26;9:869851. doi: 10.3389/fmolb.2022.869851. eCollection 2022. Front Mol Biosci. 2022. PMID: 35558561 Free PMC article.
-
DNA-binding properties of FOXP3 transcription factor.Acta Biochim Biophys Sin (Shanghai). 2017 Sep 1;49(9):792-799. doi: 10.1093/abbs/gmx079. Acta Biochim Biophys Sin (Shanghai). 2017. PMID: 28910978 Free PMC article.
-
p73, like its p53 homolog, shows preference for inverted repeats forming cruciforms.PLoS One. 2018 Apr 18;13(4):e0195835. doi: 10.1371/journal.pone.0195835. eCollection 2018. PLoS One. 2018. PMID: 29668749 Free PMC article.
-
Structure and stability insights into tumour suppressor p53 evolutionary related proteins.PLoS One. 2013 Oct 4;8(10):e76014. doi: 10.1371/journal.pone.0076014. eCollection 2013. PLoS One. 2013. PMID: 24124530 Free PMC article.
-
Acetylation of lysine 120 of p53 endows DNA-binding specificity at effective physiological salt concentration.Proc Natl Acad Sci U S A. 2011 May 17;108(20):8251-6. doi: 10.1073/pnas.1105028108. Epub 2011 Apr 27. Proc Natl Acad Sci U S A. 2011. PMID: 21525412 Free PMC article.
References
-
- The CCP4 suite: programs for protein crystallography. Acta crystallographica. 1994;50:760–763. - PubMed
-
- Adams PD, Grosse-Kunstleve RW, Hung LW, Ioerger TR, McCoy AJ, Moriarty NW, Read RJ, Sacchettini JC, Sauter NK, Terwilliger TC. PHENIX: building new software for automated crystallographic structure determination. Acta crystallographica. 2002;58:1948–1954. - PubMed
-
- Balagurumoorthy P, Sakamoto H, Lewis MS, Zambrano N, Clore GM, Gronenborn AM, Appella E, Harrington RE. Four p53 DNA-binding domain peptides bind natural p53-response elements and bend the DNA. Proceedings of the National Academy of Sciences of the United States of America. 1995;92:8591–8595. - PMC - PubMed
-
- Brunger AT, Adams PD, Clore GM, DeLano WL, Gros P, Grosse-Kunstleve RW, Jiang JS, Kuszewski J, Nilges M, Pannu NS, et al. Crystallography & NMR system: A new software suite for macromolecular structure determination. Acta crystallographica. 1998;54:905–921. - PubMed
Publication types
MeSH terms
Substances
Associated data
- Actions
Grants and funding
LinkOut - more resources
Full Text Sources
Molecular Biology Databases
Research Materials
Miscellaneous
