. 2010 Feb 16;18(2):248-59.
doi: 10.1016/j.devcel.2009.12.018.

Kinetochores generate microtubules with distal plus ends: their roles and limited lifetime in mitosis

Affiliations

Kinetochores generate microtubules with distal plus ends: their roles and limited lifetime in mitosis

Etsushi Kitamura et al. Dev Cell. .

Abstract

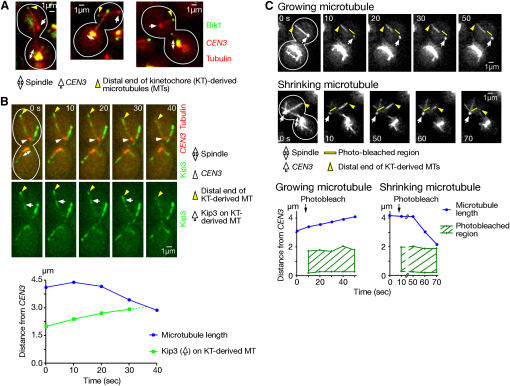
In early mitosis, microtubules can be generated at kinetochores as well as at spindle poles. However, the role and regulation of kinetochore-derived microtubules have been unclear. In general, metaphase spindle microtubules are oriented such that their plus ends bind to kinetochores. However, we now have evidence that, during early mitosis in budding yeast, microtubules are generated at kinetochores with distal plus ends. These kinetochore-derived microtubules interact along their length with microtubules that extend from a spindle pole, facilitating kinetochore loading onto the lateral surface of spindle pole microtubules. Once kinetochores are loaded, microtubules are no longer generated at kinetochores, and those that remain disappear rapidly and do not contribute to the metaphase spindle. Stu2 (the ortholog of vertebrate XMAP215/ch-TOG) localizes to kinetochores and plays a central role in regulating kinetochore-derived microtubules. Our work provides insight into microtubule generation at kinetochores and the mechanisms that facilitate initial kinetochore interaction with spindle pole microtubules.


Figures

None
Graphical abstract
Figure 1
Figure 1
Microtubules Are Generated at Kinetochores prior to Their Interaction with Spindle Pole Microtubules (A) Tubulin signals are found at reassembled KTs before their interaction with spindle pole MTs in S phase. CTF19-3×GFP MTW1-3×GFP YFP-TUB1 cells (T3110) were treated with α factor and subsequently released to fresh media. After 25 min, YFP (tubulin; red) and GFP (Ctf19, Mtw1; green) images were acquired. Cell shapes are outlined in white. (B) Tubulin signals are found at CEN3 after its reactivation and showed extension in some cases. (i and iii) Pgal-CEN3-tetOs (replacing CEN3) TetR-3×CFP YFP-TUB1 Pmet3-CDC20 cells (T3828) were treated with α factor in methionine drop-out medium with raffinose for 2.5 hr, and then released to YP medium containing galactose, raffinose, and 2 mM methionine. After 3.5 hr, cells were suspended in synthetic complete medium containing glucose and methionine. Subsequently, YFP (tubulin; red) and CFP (CEN3; green) images were acquired. (ii) Pgal-CEN3-tetOs (replacing CEN15) TEL15R-tetOs TEL15L-tetOs TetR-GFP YFP-TUB1 Pmet3-CDC20 cells (T3845) were treated in the same way, and YFP (tubulin; red) and GFP (CEN, TELs on chromosome XV; green) images were acquired. (C) Tubulin signals extended from CEN3 for a greater length, under a mild osmotic stress. T3828 cells were treated as in (B), but 1/10 volume of 1 M sorbitol was added immediately after transfer to glucose-containing medium. YFP (tubulin; red) and CFP (CEN3; green) images were acquired every 30 s (time 0, start of image acquisition). MT extensions from CEN3 are shown in (i) a representative time-lapse sequence and (ii) selected images. See also Supplemental Experimental Procedures and Movie S1. See Figure S1 in Supplemental Information.
Figure 2
Figure 2
Kinetochore-Derived Microtubules Have Their Plus Ends Distal to Kinetochores (A) Bik1 signals were found at the distal ends of KT-derived MTs, but not at CEN3. Pgal-CEN3-tetOs TetR-3×CFP CFP-TUB1 BIK1-3×YFP Pmet3-CDC20 cells (T3673) were treated as in Figure 1C. YFP (Bik1; green) and CFP (CEN3, tubulin; red) images were acquired. (B) Kip3 moved along KT-derived MTs, heading toward the end distal to CEN3. Pgal-CEN3-tetOs TetR-3×CFP CFP-TUB1 KIP3-3×GFP Pmet3-CDC20 cells (T3981) were treated as in Figure 1C. GFP (Kip3; green) and CFP (CEN3, tubulin; red) images were acquired every 10 s (time 0, arbitrary). Representative time-lapse images (top) and graphs (bottom) showing the length of the relevant KT-derived MT as well as the position of a Kip3 signal (indicated by arrows in top panels) on it. (C) Polymerization and depolymerization of KT-derived MTs occurred at the ends distal to CEN3. Pgal-CEN3-tetOs TetR-GFP YFP-TUB1 Pmet3-CDC20 cells (T3531) were treated as in Figure 1C. A small region, close to CEN3, on a KT-derived MT was photobleached between 0 and 10 s, while the KT-derived MT was either growing or shrinking (in five and six cells, respectively). YFP (tubulin) and GFP (CEN3) signals were acquired together every 10 s (time 0, arbitrary). Representative time-lapse images (top) and graphs (bottom) showing the length of the KT-derived MTs and the positions of the photobleached regions. Other cells showed similar results. See Figure S2 in Supplemental Information.
Figure 3
Figure 3
Kinetochore Components and +TIPs, but Not the γ-Tubulin Complex, Facilitate the Generation of Microtubules from Kinetochores (A) Summary of mutant phenotypes. Using the CEN reactivation assay (Figure S1A), (i and iii) the extension of spindle pole and KT-derived MTs (original data, not shown and in Figure S3B, respectively) as well as (ii and iv) tubulin and Stu2 signals at KTs (original data in Figures S3A and S3E, respectively) were studied in wild-type and various mutant cells. NA, not applicable; ND, not determined. (B) ndc10-1 mutant cells were defective in the nucleation of MTs at KTs and CEN3 interaction with spindle pole MTs. Wild-type NDC10+ (T3828) and ndc10-1 (T4230) cells with Pgal-CEN3-tetOs TetR-3×CFP YFP-TUB1 Pmet3-CDC20 were treated as in Figure 1B, but the temperature was raised to 35°C 30 min before cells were suspended in synthetic complete medium containing glucose and methionine. YFP (tubulin; red) and CFP (CEN3; green) images were acquired every 5 min at 35°C. Top: representative time-lapse images (time 0: transfer to glucose-containing medium). Bottom: changes in percentages of cells in which CEN3 was (yellow) and was not (magenta) associated with spindle pole MTs. The latter cases were further divided into two, in which tubulin signals were found (red) or not (blue) at CEN3. n, number of observed cells. (C) The stu2-10 mutant was defective in the nucleation of MTs at CEN3, but showed normal KT reassembly. Wild-type STU2+ (T6670) and stu2-10 (T7285) cells with Pgal-CEN3-tetOs TetR-3×CFP YFP-TUB1 MTW1-4×mCherry NDC80-4×mCherry Pmet3-CDC20 were treated as in (B). mCherry (KTs; Mtw1, Ndc80; green), YFP (tubulin; red), and CFP (CEN3; blue) images were acquired every 5 min. Data are presented as in (B) (the presence of KT signals is shown in green stripes). (D) Localization of Stu2 at CEN3 and the plus ends of KT-derived MTs. Pgal-CEN3-tetOs TetR-3×CFP YFP-TUB1 STU2-4×mCherry Pmet3-CDC20 cells (T6987) were treated as in Figure 1C. mCherry (Stu2; green), YFP (tubulin; red), and CFP (CEN3; blue) images were acquired every 20 s (time 0; arbitrary). See also Movie S2. See Figure S3 in Supplemental Information.
Figure 4
Figure 4
Stu2 Is Sufficient to Nucleate and Extend Microtubules when It Is Tethered on a Chromosome Arm Locus (A) A schematic diagram of Stu2 tethering on a chromosome arm locus. See text for details. (B) Tubulin signals were often found at the Stu2-tethered site. Pgals-STU2-GFP-LacI REC102::lacOs CFP-TUB1 Pmet3-CDC20 (T4837) cells were treated with α factor in methionine drop-out medium with raffinose for 2.5 hr, and then released to YP medium containing raffinose and 2 mM methionine. After 2.5 hr, galactose was added to the medium (time 0 in graphs). As controls, cells with Pgals-GFP-LacI instead of Pgals-STU2-GFP-LacI (T4601) and cells lacking lacOs (T4840) were treated in the same way. GFP (Stu2 fused with LacI or LacI alone; green) and CFP (tubulin; red) images were acquired at indicated time points. Percentages of cells in each category (top) and representative images (at 60 min in graphs: bottom) of T4601, T4840, and T4837 cells (left to right). (C) MTs extended from the Stu2-tethered site with distal plus ends. T4837 cells (see [B]) were treated as in (B), except that 1/10 volume of 1 M sorbitol was added to medium immediately before GFP and CFP images were acquired (left). Cells (T7184) with the same genotype as T4837, but with BIK1-4×mCherry, were treated in the same way, followed by acquisition of mCherry (Bik1; red), GFP (Stu2 fused with LacI; green), and CFP (tubulin; blue) images (right). (D) MTs, extended from the Stu2-tethered site, showed interaction with spindle pole MTs. T4837 cells (see [B]) were treated as in (C). GFP and CFP images were acquired every 15 s (time 0: start of image acquistion). Representative time-lapse images (top) and schematic diagrams (bottom). See also Movie S4. See Figure S4 in Supplemental Information.
Figure 5
Figure 5
Kinetochore-Derived Microtubules Interact with Spindle Pole Microtubules, onto which Kinetochores Are Subsequently Loaded and Cease Generating Microtubules (A) KT-derived MTs interacted with spindle pole MTs, on which KTs were subsequently loaded. T3828 cells (Figure 1B) were treated as in Figure 1C. Images were acquired every 15 s. Representative time-lapse images (top) and schematic diagrams (bottom), showing interaction between a KT-derived MT and a spindle pole MT in an (i) anti-parallel and (ii) parallel manner. See also Movies S5 and S6. (B) (i) BIK1-4×mCherry (T6718) and (ii) STU2-4×mCherry (T6987) cells with Pgal-CEN3-tetOs TetR-3×CFP YFP-TUB1 Pmet3-CDC20 were treated as in Figures 1C and 1B, respectively. Images were acquired (i) every 30 s for 35 min and (ii) every 20 s for 30 min. (i) MTs did not show new growth from KTs after KTs interacted with spindle pole MTs. Graphs show the percentages of time intervals, during which new MTs started extension from CEN3 before and after CEN3 association with spindle pole MTs. n, number of observed time intervals. (ii) The amount of Stu2 at CEN3 decreased immediately after CEN3 interacted with the surface of spindle pole MTs. Representative time-lapse images showing Stu2 signals at CEN3 (arrows) in cells where CEN3s interacted with spindle pole MTs (top). The mean (and SEM) of quantified Stu2 signal intensity at CEN3 from 8 such cells (red line, bottom). Time is shown relative to CEN3 encounter with spindle pole MTs. As a control for each cell, Stu2 intensity was measured at the same time points in a neighboring cell, in which CEN3 did not interact with spindle pole MTs (blue line). n.s., not significant. See Figure S5 in Supplemental Information.
Figure 6
Figure 6
Kinetochore-Derived Microtubules Appear More Frequently When Kinetochore Interaction with Spindle Pole Microtubules Is Delayed, and then Seem to Facilitate This Interaction (A–E) MTW1-4×mCherry NDC80-4×mCherry YFP-TUB1 cells (T6444) were treated as in Figure 1A. From 20 min after washout of α factor, mCherry (KTs; green) and YFP (tubulin; red) images were collected every 10 s for 10 min. During this time window in S phase, KTs were often reassembled and reassociated with spindle pole MTs (Kitamura et al., 2007). (A) Time points in each event (75 events from 71 cells), in which KT signals were detected (first detection at time 0) away from a spindle pole and subsequently interacted with spindle pole MTs (gray box). Time points showing KT-associated MT/tubulin signals (not connected to spindle pole MTs) are indicated by cyan boxes, whereas time points showing brighter KT signals are marked with orange dots. (B) Representative time-lapse images (Event #74 in [A]) showing Mtw1-4×mCherry/Ndc80-4×mCherry signals in green and YFP-Tub1 in red. Time is shown in seconds (time 0 is as defined in [A]). (C) Percentages of time points (in [A]) within each time window, showing (i) MT/tubulin signals at KTs (cyan) or (iii) brighter KT signals (orange), as well as those showing such signals for two or more consecutive time points (ii, magenta; iv, blue). (D) Percentages of free KTs (shown in [A]), which were not yet associated with spindle pole MTs, are plotted (black dots) against the time after the first detection of KT signals (time 0 in [A]). A regression curve was drawn based on a one-phase exponential decay curve. The total number of free KTs at time 0 was predicted from this exponential decay curve, including those that escaped our observation due to a rapid interaction with spindle pole MTs after KT assembly (see Supplemental Experimental Procedures). (E) Percentages of free KTs (shown in [A]) are plotted against the time (i) after the first appearance of MT/tubulin signals at KTs (cyan) and (ii) after their first appearance for two or more sequential points (time was measured from the first time point of consecutive ones: magenta). Percentages of free KTs are also plotted against the time (iii) after the first appearance of brighter KT signals (orange) and (iv) after their first appearance for two or more sequential points (blue). In each figure, a black line links the black dots shown in (D), providing a control for comparison with each colored line. See also Supplemental Experimental Procedures. See Figure S6 in Supplemental Information.
Figure 7
Figure 7
Summary of How Microtubules Are Generated at Kinetochores, How They Facilitate Kinetochore Interaction with Spindle Pole Microtubules, and How They Disappear Afterwards, in Budding Yeast (A) MTs are generated at KTs with distal plus ends. Stu2 has a central role in promoting this process at KTs. This MT generation is more frequent when the KT interaction with spindle pole MTs is delayed. (B) KT-derived MTs interact with spindle pole-derived MTs. This interaction takes place either in an (i) antiparallel or (ii) parallel manner, and facilitates KT loading onto the lateral side of spindle pole MTs. (C and D) After KTs are loaded onto the lateral side of spindle pole MTs, the amount of Stu2 at KTs is reduced and new MT generation at KTs is suppressed. Existing KT-derived MTs shrink and quickly disappear. (E) KTs subsequently attach to the distal plus ends of spindle pole MTs (Tanaka et al., 2007).

Similar articles

Cited by

References

    1. Akhmanova A., Steinmetz M.O. Tracking the ends: a dynamic protein network controls the fate of microtubule tips. Nat. Rev. Mol. Cell Biol. 2008;9:309–322. - PubMed
    1. Al-Bassam J., van Breugel M., Harrison S.C., Hyman A. Stu2p binds tubulin and undergoes an open-to-closed conformational change. J. Cell Biol. 2006;172:1009–1022. - PMC - PubMed
    1. Athale C.A., Dinarina A., Mora-Coral M., Pugieux C., Nedelec F., Karsenti E. Regulation of microtubule dynamics by reaction cascades around chromosomes. Science. 2008;322:1243–1247. - PubMed
    1. Bergen L.G., Kuriyama R., Borisy G.G. Polarity of microtubules nucleated by centrosomes and chromosomes of Chinese hamster ovary cells in vitro. J. Cell Biol. 1980;84:151–159. - PMC - PubMed
    1. Brouhard G.J., Stear J.H., Noetzel T.L., Al-Bassam J., Kinoshita K., Harrison S.C., Howard J., Hyman A.A. XMAP215 is a processive microtubule polymerase. Cell. 2008;132:79–88. - PMC - PubMed

Publication types

MeSH terms

Substances