. 2010 Feb 16;18(2):288-99.
doi: 10.1016/j.devcel.2009.12.012.

Kibra functions as a tumor suppressor protein that regulates Hippo signaling in conjunction with Merlin and Expanded

Affiliations

Kibra functions as a tumor suppressor protein that regulates Hippo signaling in conjunction with Merlin and Expanded

Jianzhong Yu et al. Dev Cell. .

Abstract

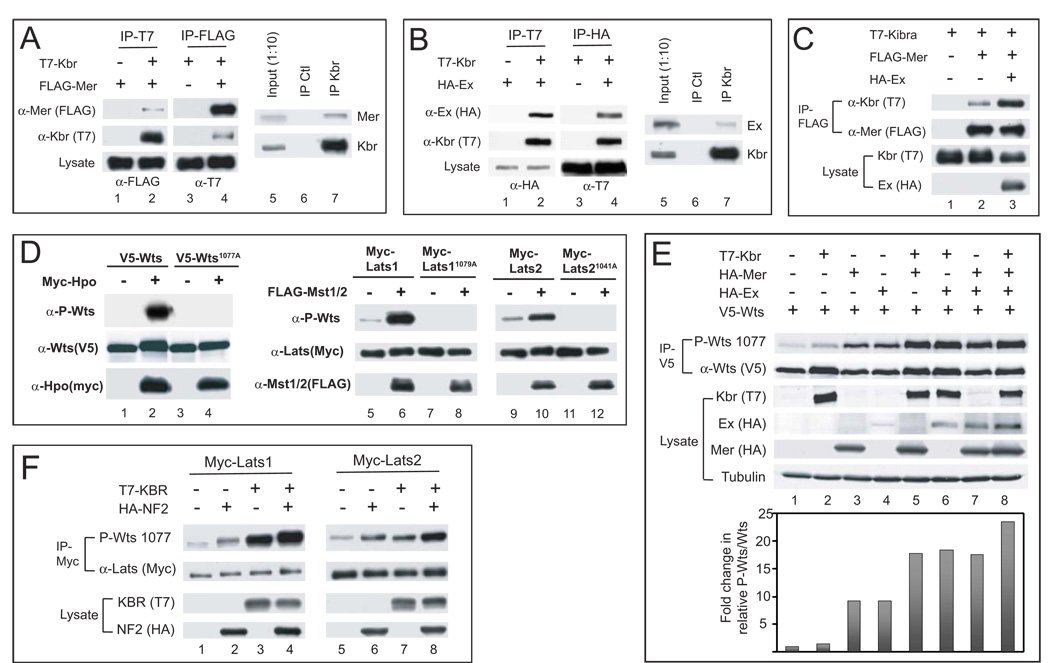
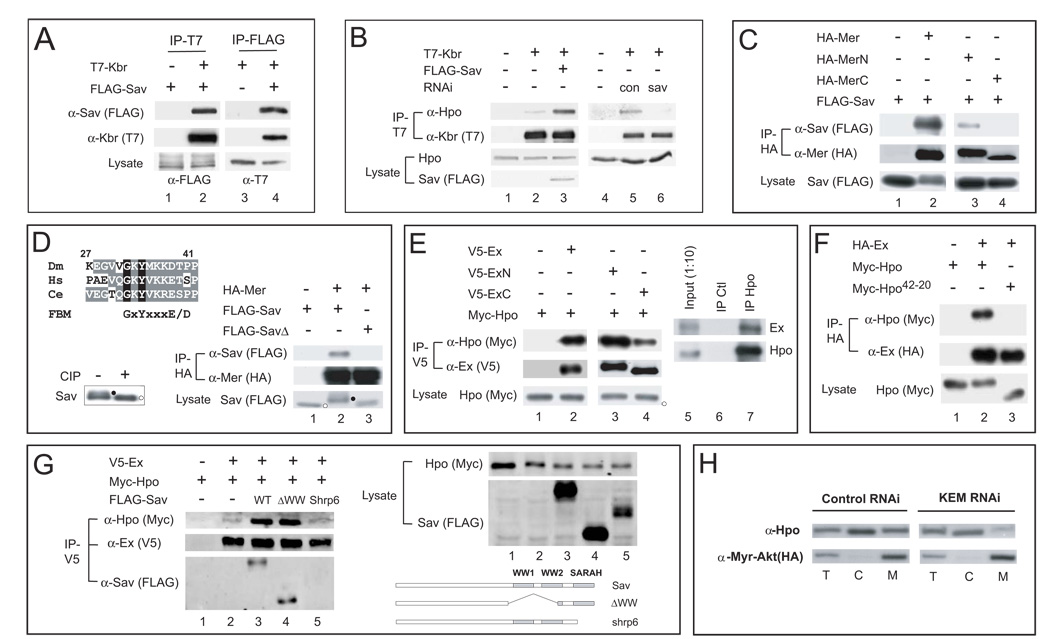
The Hippo signaling pathway regulates organ size and tissue homeostasis from Drosophila to mammals. Central to this pathway is a kinase cascade wherein Hippo (Hpo), in complex with Salvador (Sav), phosphorylates and activates Warts (Wts), which in turn phosphorylates and inactivates the Yorkie (Yki) oncoprotein, known as the YAP coactivator in mammalian cells. The FERM domain proteins Merlin (Mer) and Expanded (Ex) are upstream components that regulate Hpo activity through unknown mechanisms. Here we identify Kibra as another upstream component of the Hippo signaling pathway. We show that Kibra functions together with Mer and Ex in a protein complex localized to the apical domain of epithelial cells, and that this protein complex regulates the Hippo kinase cascade via direct binding to Hpo and Sav. These results shed light on the mechanism of Ex and Mer function and implicate Kibra as a potential tumor suppressor with relevance to neurofibromatosis.


Figures

Figure 1
Figure 1. Loss of kbr results in PFC defects similar to those caused by loss of canonical Hippo pathway genes
(A) Schematic diagram of the Drosophila Kbr protein (top; Dm) and its human orthologue KIBRA (bottom; Hs). The conserved WW domains and C2 domains are indicated. (B-E’) kbr is required for oocyte polarity. Stage-9 wildtype (B and D) and mosaic egg chambers containing large kbrdel PFC clones (GFP-negative, C-C’ and E-E’) were stained for Stau (red) or Grk (red), and counterstained with DAPI (blue). Note the mislocalization of Stau from the posterior pole to the center of the oocyte (arrowheads in B and C), the mislocalization of Grk from the dorsal anterior corner to the posterior pole of the oocyte (arrowheads in D and E), and the multiple cell layers associated with kbr PFC clones (C’ and E’). Also note the mislocalization of the oocyte nucleus to the posterior pole (arrows in C and E). (F–H) Stage 9 wildtype (F) and mosaic egg chambers containing kbr (G) or hpo (H) PFC clones (GFP-negative) were stained for Cut (red). Cut expression was undetectable in stage 9 wildtype egg chambers (F), but persisted in kbr or hpo PFC clones (arrows). (I–K) Similar to (F–H) except that stage 8 egg chambers were stained for Hnt (red). While Hnt expression was detected in all columnar follicle cells in wildtype egg chambers (I), it was abolished in kbr (J) or hpo (K) PFC clones (arrows). (L–N) Stage 8 wildtype (L) and mosaic egg chambers containing kbr (M) or sav (N) PFC clones (GFP-negative) were stained for E(spl):CD2 (red). Note the reduction of E(spl):CD2 signal in kbr (M) or sav (N) PFC clones (arrows) compared to the wildtype (L). See Figure S1 for supplemental data to Figure 1.
Figure 2
Figure 2. kbr is a negative regulator of imaginal disc growth
(A–B) Scanning electron micrographs (SEM) of a wildtype eye (A) and an eye composed predominantly of kbr mutant cells (B). Note the increased eye size in (B). Genotypes: (A) y w ey-flp; FRT82B/FRT82B Ubi-GFP, (B) y w ey-flp; FRT82B kbrdel/FRT82B Ubi-GFP. (C–D) Same as in (A–B) except that stereomicroscopic images are shown. Note that adult eyes mosaic for kbr (D) contained predominantly mutant tissues (white), whereas eyes mosaic for a control chromosome contained far less white tissues (C). (E–F) SEM images of fly eyes in which kbr was overexpressed by the GMR-Gal4 driver. Genotypes: (E) GMR-Gal4/UAS-kbr, (F) GMR-Gal4 UAS-kbr/UAS-kbr. (G–H) TUNEL staining of wildtype (G) and GMR-Gal4 UAS-kbr/UAS-kbr (H) eye imaginal discs. Note the ectopic cell death in kbr-overexpressing eye disc (H). (I–I’’’) A mid-pupal retina containing kbr mutant clones, marked by the lack of GFP (I), and stained for Discs-Large (Dlg, I’) and DAPI (I’’’). Superimposed GFP and Dlg are shown in (I’’). Note the increased number of interommatidial cells in kbr clones. See Figure S2 for supplemental data to Figure 2.
Figure 3
Figure 3. kbr regulates Hippo pathway target genes
(A-B”) Egg chambers containing kbr mutant clones (GFP-negative) and stained for diap1-lacZ (A-A”) or ex-lacZ (B-B”) reporter expression (red). Note the elevated levels of diap1-lacZ and ex-lacZ in kbr PFC clones (arrows). (C-C’’) An eye disc containing kbr mutant clones (GFP-negative) and stained with α-Ex antibody (red). Note the upregulation of Ex levels in kbr mutant cells along the morphogenetic furrow (arrows). (D-D’’) An eye disc containing kbr-overexpressing clones (GFP-positive) and stained with α-Diap1 antibody (red). Note the decreased levels of Diap1 in kbr-overexpressing clones (arrows) close to the morphogenetic furrow.
Figure 4
Figure 4. Kbr regulates Yki and Hpo phosphorylation and functions upstream of Hpo-Sav
(A–B) S2 cells were transfected with HA-Yki (A) or Myc-Hpo (B) along with no dsRNA (lane 1), control dsRNA (lane 2), or kbr dsRNA (lane 3), and probed with α-P-Yki(S168) (A) or and α-P-Hpo(T195) (B). Note the suppression of Yki and Hpo phosphorylation by kbr RNAi. (C–K) SEM images of eyes from the following genotypes: (C) wildtype, (D) GMR-Gal4; UAS-yki, (E) GMR-Gal4 UAS-kbr/UAS-kbr, (F) GMR-Gal4 UAS-kbr/UAS-kbr; UAS-yki, (G) y w ey-flp; FRT82B kbrdel/FRT82B Ubi-GFP, (H) GMR-hpo, (I) y w ey-flp; GMR-hpo; FRT82B kbrdel/FRT82B Ubi-GFP, (J) y w ey-flp; FRT82B savshrp1/FRT82B Ubi-GFP, (K) y w ey-flp; GMR-Gal4 UAS-kbr/UAS-kbr; FRT82B savshrp1/FRT82B Ubi-GFP. (L–L”) TUNEL staining of an eye disc containing sav mutant clones (GFP-negative) and simultaneously overexpressing kbr posterior to the morphogenetic furrow. Note the diminished TUNEL staining in sav mutant clones (arrow). Genotype: y w hs-flp; GMR-Gal4 UAS-kbr/UAS-kbr; FRT82B savshrp1/FRT82B Ubi-GFP.
Figure 5
Figure 5. Kbr forms a protein complex and acts synergistically with Mer and Ex to promote Wts phosphorylation
(A) Physical association between Kbr and Mer. Lanes 1–4: S2 cell lysates expressing the indicated combination of T7-Kbr and FLAG-Mer constructs were immunoprecipitated (IP) and probed with the indicated antibodies. FLAG-Mer was detected in T7-IP in the presence (lane 2), but not the absence (lane 1), of T7-Kbr. Conversely, T7-Kbr was detected in FLAG-IP in the presence (lane 4), but not the absence (lane 3), of FLAG-Mer. Lanes 5–7: α-Kbr was used to IP endogenous Kbr from untransfected S2 cells and probed with α-Mer or α-Kbr antibody. Mer was detected in Kbr-IP, not in IP with control IgG. (B) Physical association between Kbr and Ex. Lanes 1–4: similar to (A) except that T7-Kbr and HA-Ex were tested for co-IP. HA-Ex was detected in T7-IP products in the presence (lane 2), but not the absence (lane 1), of T7-Kbr. Conversely, T7-Kbr was detected in HA-IP products in the presence (lane 4), but not the absence (lane 3), of HA-Ex. Lanes 5–7: α-Kbr was used to IP endogenous Kbr from untransfected S2 cells. Ex was detected in Kbr-IP, but not in IP with control IgG. (C) Ex potentiates Kbr-Mer interaction. S2 cells expressing the indicated constructs were analyzed by co-IP. Note that in the presence of HA-Ex, significantly more T7-Kbr was detected in FLAG-Mer IP (compare lanes 3 and 2). (D) Phospho-specific antibody against the hydrophobic motif of Drosophila Wts and human Lats1/2. The indicated V5-Wts or Myc-Lats1/2 constructs were expressed in S2 cells or HEK293 cells respectively, immunoprecipitated and probed with antibodies against P-Wts (top gels) and the respective epitopes (middle gels). A fraction of cell lysate was probed with the indicated antibodies to evaluate expression levels of Myc-Hpo or FLAG-Mst1/2 (bottom gels). Hpo induced Wts T1077 phosphorylation, which was abolished by a T1077A mutation. Mst1/2 induced Lats1 T1079 or Lats2 T1041 phosphorylation, which was abolished by a Lats1 T1079A mutation or a Lats2 T1041A mutation. (E) Kbr promotes Wts phosphorylation in conjunction with Mer and Ex. V5-IP from S2 cells expressing the indicated constructs were probed with α-P-Wts(T1077) and α-V5 using the Odyssey Infrared Imaging System. A fraction of the cell lysate was probed with indicated antibodies to evaluate protein expression levels. The P-Wts signal relative to the V5-Wts signal, expressed in arbitrary units, is plotted in the graph. (F) The human KBR protein promotes Lats1/Lats2 phosphorylation in conjunction with human NF2. Myc-IP from HEK293 cells expressing the indicated constructs probed with α-P-Wts and α-Myc. A fraction of the cell lysate was probed with the indicated antibodies to evaluate protein expression levels. Note that accompanying the induced hydrophobic motif phosphorylation, KBR and NF2 also caused retarded mobility of Lats proteins, which is more obvious for Lats1 than Lats2. See Figure S3 for supplemental data to Figure 5.
Figure 6
Figure 6. Kbr functions together with Mer and Ex to regulate tissue growth and Hippo signaling in vivo
(A–F) SEM images of compound eyes from the following genotype: (A) wildtype, (B) y w ey-flp; FRT40A exel/FRT40A Ubi-GFP, (C) y w ey-flp, Ubi-GFP FRT19A/mer4 FRT19A, (D) y w ey-flp; FRT82B kbrdel/FRT82B Ubi-GFP, (E) y w ey-flp; FRT40A exel/FRT40A Ubi-GFP; FRT82B kbrdel/FRT82B Ubi-GFP, (F) y w ey-flp, Ubi-GFP FRT19A/mer4 FRT19A; FRT82B kbrdel/FRT82B Ubi-GFP. Note the smooth eye surface in (B–D) and the deformed eye surface with folded eye tissues in (E–F). (G–L) Mid-pupal retina of the indicated genotype and stained for Dlg. Twenty ommatidial clusters of each genotype were used for counting interommatidial cells. (M-O’) Third instar eye discs containing kbr (M-M”), mer (N-N”) or mer; kbr (O-O”) clones and diap1-lacZ reporter. Note the elevated levels of diap1-lacZ (red) in mer; kbr, but not kbr or mer clones (arrows).
Figure 7
Figure 7. Multiple protein-protein interactions link the KEM complex to the Hpo-Sav complex
(A) Physical association between Kbr and Sav. S2 cell lysates expressing the indicated constructs were immunoprecipitated (IP) and probed with the indicated antibodies. FLAG-Sav was detected in T7-Kbr IP. Conversely, T7-Kbr was detected in FLAG-Sav IP. (B) Sav potentiates association between Kbr and Hpo. T7-IP from S2 cells transfected with the indicated constructs or dsRNA was probed with antibody against endogenous Hpo. Note that the amount of endogenous Hpo detected in T7-Kbr IP was increased by co-expression of FLAG-Sav (compare lanes 3 and 2), and diminished by sav RNAi (compare lanes 6 and 5). (C) Physical association between Mer and Sav. FLAG-Sav was detected in HA-IP from S2 cells co-expressing HA-Mer, HA-MerN (N-terminal half of Mer), but not HA-MerC (C-terminal half of Mer). (D) Sav contains a FERM binding motif (FBM) that is required for binding to Mer. Top: alignment of FBM sequence from Sav orthologues in Drosophila (Dm), human (Hs) and worm (Ce). The consensus FBM is also shown. Lower right: HA-IP from S2 cells expressing HA-Mer with FLAG-Sav or FLAG-SavΔGKY (SavΔ) was probed with the indicated antibodies. FLAG-Sav, but not FLAG-SavΔGKY, was detected in HA-IP. Also note the mobility shift of Sav, but not SavΔGKY, induced by Mer co-expression. Lower left: phosphatase (CIP) treatment of FLAG-Sav IP from cells expressing HA-Mer and FLAG-Sav. Hyper- and hypo-phosphorylated Sav is indicated by black and white circles next to the protein bands, respectively. (E) Physical association between Ex and Hpo. Lanes 1–4: Myc-Hpo was detected in V5-IP from S2 cell co-expressing V5-Ex, V5-ExN (N-terminal half of Ex), or V5-ExC (C-terminal half of Ex). Lanes 5–7: α-Hpo was used to IP endogenous Hpo from untransfected S2 cells. Endogenous Ex was detected in Hpo-IP, but not in IP with control IgG. (F) The SARAH domain of Hpo is required for binding to Ex. HA-IP from S2 cells expressing HA-Ex with Myc-Hpo or Myc-Hpo42-20 was analyzed. Hpo42-20 mimics a hypomorphic hpo allele that deletes just the SARAH domain (Wu et al., 2003). Myc-Hpo (lane 2), but not Myc-Hpo42-20 (lane 3), was detected in HA-Ex IP. (G) Ex, Sav and Hpo can co-exist in the same complex. V5-IP from S2 cells expressing the indicated constructs was analyzed. Note that in the presence of FLAG-Sav or FLAG-SavΔWW (deleting the WW domains), but not FLAG-Savshrp6 (mimicking a sav allele that deletes just the SARAH domain (Kango-Singh et al., 2002)), significantly more Myc-Hpo was detected in V5-Ex IP (compare lanes 2–5). A small fraction of the cell lysate was probed to evaluate protein expression levels (top right). The schematic structure of Sav mutants used in the experiment is also shown (lower right). (H) The KEM complex is required for membrane association of Hpo. S2 transiently expressing a myristylated Akt construct (Verdu et al., 1999) were treated with control or dsRNAs against Kbr, Ex and Mer (KEM) and subjected to cell fractionation. Cytosolic (C), membrane (M), and a portion of the total lysate (T) were probed for endogenous Hpo. Note the decreased Hpo signal in membrane fraction upon KEM RNAi. Also note that myristylated-Akt was only recovered in the membrane fraction. See Figure S4 for supplemental data to Figure 7.

Similar articles

Cited by

References

    1. Badouel C, Gardano L, Amin N, Garg A, Rosenfeld R, Le BT, McNeill H. The FERM-domain protein expanded regulates Hippo pathway activity via direct interactions with the transcriptional activator Yorkie. Dev. Cell. 2009;16:411–420. - PubMed
    1. Bennett FC, Harvey KF. Fat cadherin modulates organ size in Drosophila via the Salvador/Warts/Hippo signaling pathway. Curr. Biol. 2006;16:2101–2110. - PubMed
    1. Boedigheimer M, Laughon A. Expanded: a gene involved in the control of cell proliferation in imaginal discs. Development. 1993;118:1291–1301. - PubMed
    1. Camargo FD, Gokhale S, Johnnidis JB, Fu D, Bell GW, Jaenisch R, Brummelkamp TR. YAP1 increases organ size and expands undifferentiated progenitor cells. Curr. Biol. 2007;17:2054–2060. - PubMed
    1. Casal J, Lawrence PA, Struhl G. Two separate molecular systems, Dachsous/Fat and Starry night/Frizzled, act independently to confer planar cell polarity. Development. 2006;133:4561–4572. - PMC - PubMed

Publication types

MeSH terms

Substances