Thoracic aortic disease in tuberous sclerosis complex: molecular pathogenesis and potential therapies in Tsc2+/- mice
- PMID: 20159776
- PMCID: PMC2860890
- DOI: 10.1093/hmg/ddq066
Thoracic aortic disease in tuberous sclerosis complex: molecular pathogenesis and potential therapies in Tsc2+/- mice
Abstract
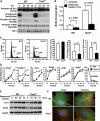
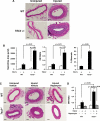
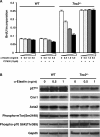
Tuberous sclerosis complex (TSC) is a genetic disorder with pleiotropic manifestations caused by heterozygous mutations in either TSC1 or TSC2. One of the less investigated complications of TSC is the formation of aneurysms of the descending aorta, which are characterized on pathologic examination by smooth muscle cell (SMC) proliferation in the aortic media. SMCs were explanted from Tsc2(+/-) mice to investigate the pathogenesis of aortic aneurysms caused by TSC2 mutations. Tsc2(+/-) SMCs demonstrated increased phosphorylation of mammalian target of rapamycin (mTOR), S6 and p70S6K and increased proliferation rates compared with wild-type (WT) SMCs. Tsc2(+/-) SMCs also had reduced expression of SMC contractile proteins compared with WT SMCs. An inhibitor of mTOR signaling, rapamycin, decreased SMC proliferation and increased contractile protein expression in the Tsc2(+/-) SMCs to levels similar to WT SMCs. Exposure to alpha-elastin fragments also decreased proliferation of Tsc2(+/-) SMCs and increased levels of p27(kip1), but failed to increase expression of contractile proteins. In response to artery injury using a carotid artery ligation model, Tsc2(+/-) mice significantly increased neointima formation compared with the control mice, and the neointima formation was inhibited by treatment with rapamycin. These results demonstrate that Tsc2 haploinsufficiency in SMCs increases proliferation and decreases contractile protein expression and suggest that the increased proliferative potential of the mutant cells may be suppressed in vivo by interaction with elastin. These findings provide insights into the molecular pathogenesis of aortic disease in TSC patients and identify a potential therapeutic target for treatment of this complication of the disease.
Figures


Similar articles
-
Enhanced expression of glucose transporter-1 in vascular smooth muscle cells via the Akt/tuberous sclerosis complex subunit 2 (TSC2)/mammalian target of rapamycin (mTOR)/ribosomal S6 protein kinase (S6K) pathway in experimental renal failure.J Vasc Surg. 2013 Feb;57(2):475-85. doi: 10.1016/j.jvs.2012.07.037. Epub 2012 Dec 21. J Vasc Surg. 2013. PMID: 23265586
-
Predisposition to tetraploidy in pulmonary vascular smooth muscle cells derived from the Eker rats.Am J Physiol Lung Cell Mol Physiol. 2007 Sep;293(3):L702-11. doi: 10.1152/ajplung.00016.2007. Epub 2007 Jun 15. Am J Physiol Lung Cell Mol Physiol. 2007. PMID: 17575014
-
Heterozygous inactivation of tsc2 enhances tumorigenesis in p53 mutant zebrafish.Dis Model Mech. 2013 Jul;6(4):925-33. doi: 10.1242/dmm.011494. Epub 2013 Mar 27. Dis Model Mech. 2013. PMID: 23580196 Free PMC article.
-
Mourning Dr. Alfred G. Knudson: the two-hit hypothesis, tumor suppressor genes, and the tuberous sclerosis complex.Cancer Sci. 2017 Jan;108(1):5-11. doi: 10.1111/cas.13116. Epub 2017 Jan 23. Cancer Sci. 2017. PMID: 27862655 Free PMC article. Review.
-
The Tsc1-Tsc2 complex influences neuronal polarity by modulating TORC1 activity and SAD levels.Genes Dev. 2008 Sep 15;22(18):2447-53. doi: 10.1101/gad.1724108. Genes Dev. 2008. PMID: 18794342 Free PMC article. Review.
Cited by
-
Aortic pathology from protein kinase G activation is prevented by an antioxidant vitamin B12 analog.Nat Commun. 2019 Aug 6;10(1):3533. doi: 10.1038/s41467-019-11389-1. Nat Commun. 2019. PMID: 31387997 Free PMC article.
-
Abdominal aortic aneurysm in a child with tuberous sclerosis.J Vasc Surg Cases Innov Tech. 2022 Jul 6;8(3):375-377. doi: 10.1016/j.jvscit.2022.05.018. eCollection 2022 Sep. J Vasc Surg Cases Innov Tech. 2022. PMID: 35936020 Free PMC article.
-
Roles of mTOR in thoracic aortopathy understood by complex intracellular signaling interactions.PLoS Comput Biol. 2021 Dec 13;17(12):e1009683. doi: 10.1371/journal.pcbi.1009683. eCollection 2021 Dec. PLoS Comput Biol. 2021. PMID: 34898595 Free PMC article.
-
Loss of myeloid Tsc2 predisposes to angiotensin II-induced aortic aneurysm formation in mice.Cell Death Dis. 2022 Nov 18;13(11):972. doi: 10.1038/s41419-022-05423-2. Cell Death Dis. 2022. PMID: 36400753 Free PMC article.
-
A Rare Case of an Abdominal Aneurysm in a Patient with Lymphangioleiomyomatosis: A Case Report.Perm J. 2019;23:18-170. doi: 10.7812/TPP/18-170. Perm J. 2019. PMID: 30939284 Free PMC article.
References
-
- Osborne J.P., Fryer A., Webb D. Epidemiology of tuberous sclerosis. Ann. N. Y. Acad. Sci. 1991;615:125–127. - PubMed
-
- van Slegtenhorst M., de Hoogt R., Hermans C., Nellist M., Janssen B., Verhoef S., Lindhout D., van den O.A., Halley D., Young J., et al. Identification of the tuberous sclerosis gene TSC1 on chromosome 9q34. Science. 1997;277:805–808. - PubMed
-
- The European Chromosome 16 Tuberous Sclerosis Consortium. Identification and characterization of the tuberous sclerosis gene on chromosome 16. Cell. 1993;75:1305–1315. - PubMed
-
- Wienecke R., Konig A., DeClue J.E. Identification of tuberin, the tuberous sclerosis-2 product. Tuberin possesses specific Rap1GAP activity. J. Biol. Chem. 1995;270:16409–16414. - PubMed
-
- Xiao G.H., Shoarinejad F., Jin F., Golemis E.A., Yeung R.S. The tuberous sclerosis 2 gene product, tuberin, functions as a Rab5 GTPase activating protein (GAP) in modulating endocytosis. J. Biol. Chem. 1997;272:6097–6100. - PubMed
Publication types
MeSH terms
Substances
Grants and funding
LinkOut - more resources
Full Text Sources
Medical
Molecular Biology Databases
Miscellaneous

