

Consistency of methods for analysing location-specific data
- PMID: 20159917
- PMCID: PMC2868070
- DOI: 10.1093/rpd/ncq030
Consistency of methods for analysing location-specific data
Abstract
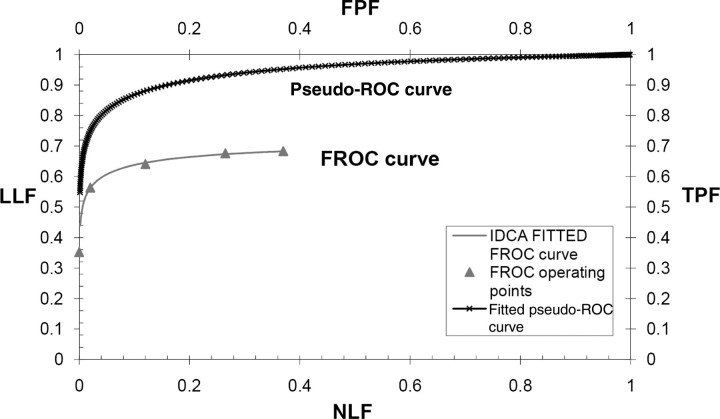
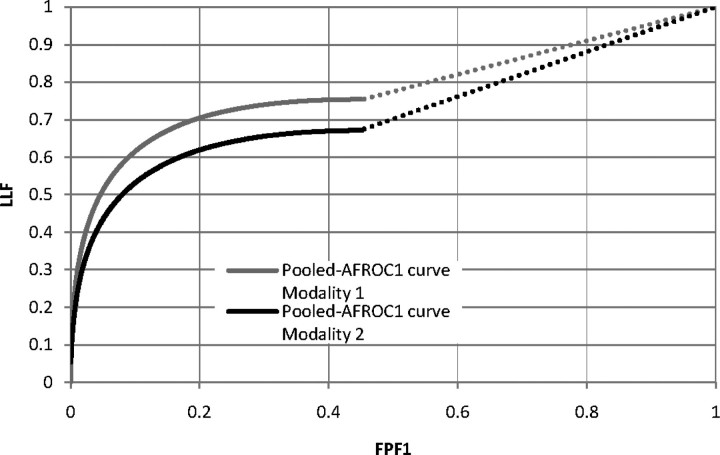
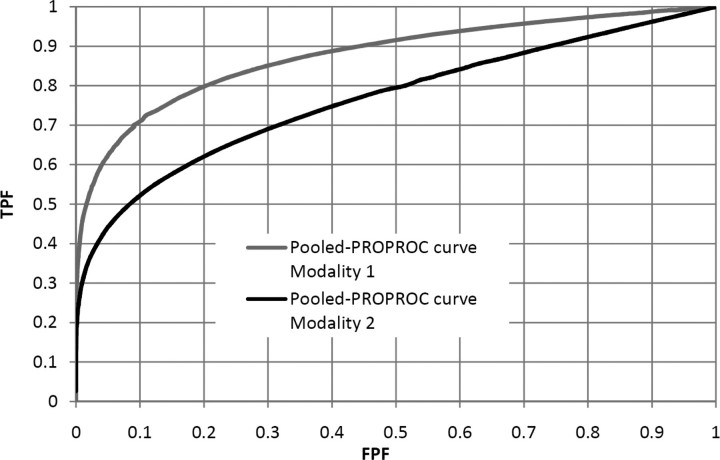
Although the receiver operating characteristic (ROC) method is the acknowledged gold-standard for imaging system assessment, it ignores localisation information and differentiation between multiple abnormalities per case. As the free-response ROC (FROC) method uses localisation information and more closely resembles the clinical reporting process, it is being increasingly used. A number of methods have been proposed to analyse the data that result from an FROC study: jackknife alternative FROC (JAFROC) and a variant termed JAFROC1, initial detection and candidate analysis (IDCA) and ROC analysis via the reduction of the multiple ratings on a case to a single rating. The focus of this paper was to compare JAFROC1, IDCA and the ROC analysis methods using a clinical FROC human data set. All methods agreed on the ordering of the modalities and all yielded statistically significant differences of the figures-of-merit, i.e. p < 0.05. Both IDCA and JAFROC1 yielded much smaller p-values than ROC. The results are consistent with a recent simulation-based validation study comparing these and other methods. In conclusion, IDCA or JAFROC1 analysis of FROC human data may be superior at detecting modality differences than ROC analysis.
Figures
Similar articles
-
A status report on free-response analysis.Radiat Prot Dosimetry. 2010 Apr-May;139(1-3):20-5. doi: 10.1093/rpd/ncp305. Epub 2010 Jan 18. Radiat Prot Dosimetry. 2010. PMID: 20085898 Free PMC article.
-
Clinical relevance of the ROC and free-response paradigms for comparing imaging system efficacies.Radiat Prot Dosimetry. 2010 Apr-May;139(1-3):37-41. doi: 10.1093/rpd/ncq017. Epub 2010 Feb 5. Radiat Prot Dosimetry. 2010. PMID: 20139268 Free PMC article.
-
Validation and statistical power comparison of methods for analyzing free-response observer performance studies.Acad Radiol. 2008 Dec;15(12):1554-66. doi: 10.1016/j.acra.2008.07.018. Acad Radiol. 2008. PMID: 19000872 Free PMC article.
-
ROC, LROC, FROC, AFROC: an alphabet soup.J Am Coll Radiol. 2009 Sep;6(9):652-5. doi: 10.1016/j.jacr.2009.06.001. J Am Coll Radiol. 2009. PMID: 19720362 Review. No abstract available.
-
Analysis of location specific observer performance data: validated extensions of the jackknife free-response (JAFROC) method.Acad Radiol. 2006 Oct;13(10):1187-93. doi: 10.1016/j.acra.2006.06.016. Acad Radiol. 2006. PMID: 16979067 Review.
Cited by
-
Evaluating imaging and computer-aided detection and diagnosis devices at the FDA.Acad Radiol. 2012 Apr;19(4):463-77. doi: 10.1016/j.acra.2011.12.016. Epub 2012 Feb 3. Acad Radiol. 2012. PMID: 22306064 Free PMC article.
References
-
- Metz C. E. Receiver operating characteristic analysis: a tool for the quantitative evaluation of observer performance and imaging systems. J. Am. Coll. Radiol. 2006;3:413–422. - PubMed
-
- Chakraborty D. P., Winter L. H. Free-response methodology: alternate analysis and a new observer—performance experiment. Radiology. 1990;174:873–881. - PubMed
-
- Chakraborty D. P. Statistical power in observer—performance studies: comparison of the receiver operating characteristic and free-response methods in tasks involving localization. Acad. Radiol. 2002;9:147–156. - PubMed
-
- Chakraborty D. P., Berbaum K. S. Observer studies involving detection and localization: modeling, analysis, and validation. Med. Phys. 2004;31:2313–2330. - PubMed
-
- Swensson R. G. Unified measurement of observer performance in detecting and localizing target objects on images. Med. Phys. 1996;23:1709–1725. - PubMed
Publication types
MeSH terms
Grants and funding
LinkOut - more resources
Full Text Sources
Research Materials
