. 2010 May;77(5):804-17.
doi: 10.1124/mol.109.062208. Epub 2010 Feb 16.

Modulation of silent and constitutively active nociceptin/orphanin FQ receptors by potent receptor antagonists and Na+ ions in rat sympathetic neurons

Affiliations

Modulation of silent and constitutively active nociceptin/orphanin FQ receptors by potent receptor antagonists and Na+ ions in rat sympathetic neurons

Saifeldin Mahmoud et al. Mol Pharmacol. 2010 May.

Abstract

The pharmacology of G protein-coupled receptors can be influenced by factors such as constitutive receptor activation and Na(+) ions. In this study, we examined the coupling of natively and heterologously expressed nociceptin/orphanin FQ (N/OFQ) peptide (NOP) receptors with voltage-dependent Ca(2+) channels after exposure to four high-affinity NOP receptor blockers [[Nphe(1)Arg(14)Lys(15)]N/OFQ-NH(2) (UFP-101), 1-[1-(cyclooctylmethyl)-1,2,3,6-tetrahydro-5-(hydroxymethyl)-4-pyridinyl]-3-ethyl-1,3-dihydro-2H-benzimidazol-2-one (Trap-101), 1-benzyl-N-{3-[spiroisobenzofuran-1(3H),4'-piperidin-1-yl]propyl}pyrrolidine-2-carboxamide (compound 24), and N-(4-amino-2-methylquinolin-6-yl)-2-(4-ethylphenoxymethyl)benzamide hydrochloride (JTC-801)] in sympathetic neurons. The enhanced tonic inhibition of Ca(2+) currents in the absence of agonists, indicative of constitutively active NOP receptors in transfected neurons, was abolished after pretreatment with pertussis toxin. In control neurons, the four antagonists did not exert any effects when applied alone but significantly blocked the N/OFQ-mediated Ca(2+) current inhibition. Exposure of transfected neurons to UFP-101 resulted in partial agonist effects. In contrast, Trap-101, compound 24, and JTC-801 exerted inverse agonism, as measured by the loss of tonic Ca(2+) current inhibition. In experiments designed to measure the N/OFQ concentration-response relationship under varying Na(+) concentrations, a leftward shift of IC(50) values was observed after Na(+) exposure. Although similar N/OFQ efficacies were measured with all solutions, a significant decrease of Hill coefficient values was obtained with increasing Na(+) concentrations. Examination of the allosteric effects of Na(+) on heterologously overexpressed NOP receptors showed that the tonic Ca(2+) current inhibition was abolished in the presence of the monovalent cation. These results demonstrate that constitutively active NOP receptors exhibit differential blocker pharmacology and allosteric regulation by Na(+). Data are also presented demonstrating that heterologously expressed mu opioid receptors in sympathetic neurons are similarly modulated.


Figures
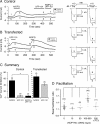
Fig. 1.
Fig. 1.
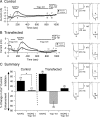
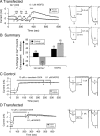
The peptide UFP-101 exerts weak partial agonist effects on constitutively active NOP receptors. Time courses of Ca2+ current amplitude for prepulse (●) and postpulse (○) acquired from the application of N/OFQ (0.1 μM), UFP-101 (1 μM), and N/OFQ + UFP-101 in control (A) and NOP receptor cDNA-transfected SG neurons (B), respectively. Currents were evoked every 10 s with the “double-pulse” voltage protocol (A, top right). The numbered Ca2+ current traces in A are shown to the right, where 1 and 2 (black) represent control currents (before N/OFQ exposure), 3 and 4 (gray) represent inhibition at the end of N/OFQ exposure, 5 and 6 (black) represent current amplitude at the end of 2-min UFP-101 (1 μM) exposure, and 7 and 8 (gray) represent inhibition at the end of N/OFQ + UFP-101 exposure. In B, traces 1 and 2 (black) represent control, 3 and 4 (gray) represent inhibition at the end of UFP-101 exposure, 5 and 6 (black) represent current amplitude before N/OFQ application, and 7 and 8 (gray) represent inhibition at the end of N/OFQ exposure. Note that at the beginning of the recordings, the ratio of postpulse to prepulse Ca2+ current (e.g., measure of basal facilitation ratio) in B is greater than in the control neuron A, indicating tonic Ca2+ current inhibition resulting from NOP receptor overexpression. C, summary graph showing mean ± S.E. Ca2+ current inhibition mediated by N/OFQ, UFP-101, and N/OFQ + UFP-101 in control and SG neurons microinjected with NOP receptor cDNA. *, P < 0.01 compared with N/OFQ applied alone, paired t test. Numbers in parenthesis indicate the number of neurons tested. D, summary scatter plot of basal facilitation ratio for control neurons and neurons microinjected with NOP cDNA at 10, 50, 100 to 800, and 500 (treated with PTX) ng/μl. Horizontal lines represent the mean, and the numbers in parentheses indicate the number of neurons tested. *, analysis of variance (P < 0.001) followed by Newman-Keuls test.
Fig. 2.
Fig. 2.
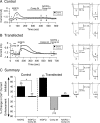
Trap-101 exerts inverse agonism on constitutively active NOP receptors. Time courses of Ca2+ current amplitude for prepulse (●) and postpulse (○) acquired from the application of N/OFQ (0.1 μM), Trap-101 (1 μM), and N/OFQ + Trap-101 in control (A) and NOP receptor cDNA-transfected SG neurons (B), respectively. Currents were evoked every 10 s with the double-pulse voltage protocol (A, top right). The numbered Ca2+ current traces in A are shown to the right, where 1 and 2 (black) represent control currents, 3 and 4 (gray) represent inhibition at the end of N/OFQ exposure, 5 and 6 (black) represent current amplitude at the end of a 3-min Trap-101 (1 μM) exposure, and 7 and 8 (gray) represent inhibition at the end of N/OFQ + Trap-101 exposure. In B, traces 1 and 2 (black) represent control currents, 3 and 4 (gray) represent current enhancement at the end of Trap-101 exposure, 5 and 6 (black) represent inhibition before N/OFQ application, 7 and 8 (gray) represent inhibition at the end of N/OFQ exposure, 9 and 10 represent inhibition at the end of a 3-min Trap-101 application, and 11 and 12 (gray) represent inhibition at the end of N/OFQ + Trap-101 exposure. C, summary graph showing mean ± S.E. percentage of change in Ca2+ current inhibition or enhancement mediated by N/OFQ, Trap-101, and N/OFQ + Trap-101 in control and transfected SG neurons. *, P < 0.01 compared with N/OFQ applied alone, paired t test. Numbers in parentheses indicate the number of neurons tested.
Fig. 3.
Fig. 3.
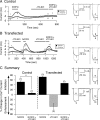
Compound 24 exerts inverse agonism on constitutively active NOP receptors. Time courses of Ca2+ current amplitude for prepulse (●) and postpulse (○) acquired from the application of N/OFQ (0.1 μM), compound 24 (1 μM), and N/OFQ + compound 24 in control (A) and NOP receptor cDNA-transfected SG neurons (B), respectively. Currents were evoked every 10 s with the double-pulse voltage protocol (A, top right). The numbered Ca2+ current traces in A are shown to the right, where 1 and 2 (black) represent control currents, 3 and 4 (gray) represent inhibition at the end of N/OFQ exposure, 5 and 6 (black) represent current amplitude at the end of a 3-min compound 24 (1 μM) exposure, and 7 and 8 (gray) represent inhibition at the end of N/OFQ + compound 24 exposure. In B, traces 1 and 2 (black) represent control currents, 3 and 4 (gray) represent current enhancement at the end of compound 24 exposure, 5 and 6 (black) represent amplitude before N/OFQ application, 7 and 8 (gray) represent inhibition at the end of N/OFQ exposure, 9 and 10 (black) represent amplitude at the end of a 3-min compound 24 exposure, and 11 and 12 (gray) represent inhibition at the end of N/OFQ + compound 24 exposure. C, summary graph showing mean ± S.E. (except for N/OFQ + compound 24, n = 2) percentage change in Ca2+ current inhibition or enhancement mediated by N/OFQ and compound 24 in control and transfected SG neurons. *, P < 0.01 compared with N/OFQ applied alone, paired t test. Numbers in parentheses indicate the number of neurons tested.
Fig. 4.
Fig. 4.
JTC-801 exerts inverse agonism on constitutively active NOP receptors. Time courses of Ca2+ current amplitude for prepulse (●) and postpulse (○) acquired from the application of N/OFQ (0.1 μM), JTC-801 (1 μM), and N/OFQ + JTC-801 in control (A) and NOP receptor cDNA-injected SG neurons (B), respectively. Currents were evoked every 10 s with the double-pulse voltage protocol (A, top right). The numbered Ca2+ current traces in A are shown to the right, where 1 and 2 (black) represent control, 3 and 4 (gray) represent inhibition at the end of N/OFQ exposure, 5 and 6 (black) represent current amplitude at the end of 3-min JTC-101 (1 μM) exposure, and 7 and 8 (gray) represent inhibition at the end of N/OFQ + JTC-801 exposure. In B, traces 1 and 2 (black) represent control currents, 3 and 4 (gray) represent enhancement at the end of JTC-801 exposure, 5 and 6 (black) represent amplitude before N/OFQ application, 7 and 8 (gray) represent inhibition at the end of N/OFQ exposure, 9 and 10 (black) represent amplitude at the end of a 3-min JTC-801 exposure, and 11 and 12 (gray) represent inhibition at the end of N/OFQ + JTC-801 exposure. C, summary graph showing mean ± S.E. (except for N/OFQ + JTC-801, n = 2) percentage change in Ca2+ current inhibition or enhancement mediated by N/OFQ and JTC-801 in control and transfected SG neurons. *, P < 0.01 compared with N/OFQ applied alone, paired t test. Numbers in parentheses indicate the number of neurons tested.
Fig. 5.
Fig. 5.
Switching external solutions from 0 to 120 mM Na+ leads to a reduction in peak Ca2+ current. Time courses of Ca2+ current amplitude inhibition for prepulse (●) and postpulse (○) acquired while switching external solutions from 0 to 120 mM Na+ with either “NMG” (A) or “Cs+” internal (D) solutions. Ca2+ currents were evoked every 10 s with the double-pulse voltage protocol (B, top). The numbered Ca2+ current traces in A and D are shown at the bottom of each time course. Current traces represent current amplitude before (1 and 2, black) and during (3 and 4, gray) Na+ exposure. The broken circles in B and E point to a tail current carried by Na+. I-V curves for the neurons in A and B are shown in E and F before (●) and during (○) 120 mM Na+ exposure. Currents were elicited by a 70-ms depolarizing pulse from a holding potential of −80 mV to potential ranging from −60 to 60 mV.
Fig. 6.
Fig. 6.
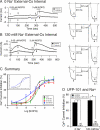
External Na+ causes leftward shifts of the N/OFQ concentration-response relationships. Time courses of Ca2+ current amplitude inhibition for prepulse (●) and postpulse (○) acquired from the sequential application of 0.03 and 3 μM N/OFQ in SG neurons in 0 (A) and 120 mM Na+ (B). Currents were evoked every 10 s with the double-pulse voltage protocol (top Fig. 5B). The numbered Ca2+ current traces in A and B are shown to the right. Black traces represent control current amplitudes and gray traces represent current amplitude in the presence of N/OFQ. C, concentration-response curves in SG neurons exposed to N/OFQ in 0 (black circles), 12 (green circles), 60 (red circles), and 120 (blue circles) mM Na+-containing external solutions. Each data point represents the mean (± S.E., n = 4–19) prepulse Ca2+ current inhibition. The smooth curves were obtained by fitting the points to the Hill equation. The inset shown is a replicate of the data and curve fits for SG neurons exposed to N/OFQ in 0 and 120 mM Na+ to highlight the effect of the cation. D, summary graph showing mean ± S.E. Ca2+ current inhibition mediated by N/OFQ in SG neurons in 0 and 120 mM Na+ during application of N/OFQ (■) and N/OFQ + UFP-101 (■). *, P < 0.01 compared with N/OFQ applied alone, paired t test. Numbers in parentheses indicate the number of neurons tested.
Fig. 7.
Fig. 7.
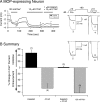
Constitutively active (A) NOP receptors heterologously overexpressed in SG neurons are modulated by Na+ ions. Time course of Ca2+ current amplitude inhibition for prepulse (●) and postpulse (○) acquired from the sequential application of 120, 60, and 12 mM Na+ and 0.1 μM N/OFQ in SG neurons microinjected with NOP receptor cDNA (A). Currents were evoked every 10 s with the double-pulse voltage protocol (top Fig. 5B) in the absence (black traces) or presence (gray traces) of either Na+ or N/OFQ. The numbered Ca2+ current traces in A are shown to the right. B, summary graph of mean (± S.E.) percentage change in Ca2+ current produced by Na+ (120 mM) and N/OFQ (0.1 μM). The percentage change was determined from the Ca2+ current amplitude measured isochronally at 10 ms into the prepulse (+10 mV) in the absence and presence of agonist in control (■) and NOP receptor-transfected (■) SG neurons. Numbers in parenthesis indicate the number of experiments. Time courses of peak Ca2+ current amplitude for prepulse and postpulse acquired from the sequential application of ω-conotoxin GVIA (10 μM, gray traces) and N/OFQ (0.1 μM) in control (C) and NOP receptor-transfected (D) SG neurons. Currents were evoked every 10 s as in A. The numbered Ca2+ current traces in C and D are shown to the right.
Fig. 8.
Fig. 8.
Na+ ion-mediated allosteric effects and CTAP inverse agonism on constitutively active MOP receptors heterologously expressed in SG neurons. A, time course of peak Ca2+ current amplitude inhibition for prepulse (●) and postpulse (○) currents before and during exposure to DAMGO (1 μM), CTAP (10 μM), DAMGO + CTAP, and 120 mM Na+. Ca2+ currents were evoked every 10 s with the double-pulse voltage protocol (A, top right) in the absence (black traces 1 and 2, 5 and 6) or presence (gray traces 3 and 4, 7, and 8) of 120 mM Na+ and DAMGO + CTAP, respectively. B, summary graph of mean (± S.E.) percentage change in Ca2+ current produced by DAMGO, CTAP, DAMGO + CTAP, and external Na+ (120 mM) in MOP receptor-expressing SG neurons. The percentage change was determined from the Ca2+ current amplitude measured isochronally at 10 ms into the prepulse (+10 mV) in the absence and presence of compound. Numbers in parentheses indicate the number of experiments.

Similar articles

Cited by

References

    1. Andoh T, Itoh M, Kuraishi Y. (1997) Nociceptin gene expression in rat dorsal root ganglia induced by peripheral inflammation. Neuroreport 8:2793–2796 - PubMed
    1. Ardati A, Henningsen RA, Higelin J, Reinscheid RK, Civelli O, Monsma FJ., Jr (1997) Interaction of [3H]orphanin FQ and 125I-Tyr14-orphanin FQ with the orphanin FQ receptor: kinetics and modulation by cations and guanine nucleotides. Mol Pharmacol 51:816–824 - PubMed
    1. Barnes TA, McDonald J, Rowbotham DJ, Duarte TL, Lambert DG. (2007) Effects of receptor density on Nociceptin/OrphaninFQ peptide receptor desensitisation: studies using the ecdysone inducible expression system. Naunyn Schmiedebergs Arch Pharmacol 376:217–225 - PubMed
    1. Beedle AM, McRory JE, Poirot O, Doering CJ, Altier C, Barrere C, Hamid J, Nargeot J, Bourinet E, Zamponi GW. (2004) Agonist-independent modulation of N-type calcium channels by ORL1 receptors. Nat Neurosci 7:118–125 - PubMed
    1. Briscini L, Corradini L, Ongini E, Bertorelli R. (2002) Up-regulation of ORL-1 receptors in spinal tissue of allodynic rats after sciatic nerve injury. Eur J Pharmacol 447:59–65 - PubMed

Publication types

MeSH terms