. 2010 Mar 15;123(Pt 6):861-70.
doi: 10.1242/jcs.060475. Epub 2010 Feb 16.

GSK-3beta promotes cell survival by modulating Bif-1-dependent autophagy and cell death

Affiliations

GSK-3beta promotes cell survival by modulating Bif-1-dependent autophagy and cell death

Jun Yang et al. J Cell Sci. .

Abstract

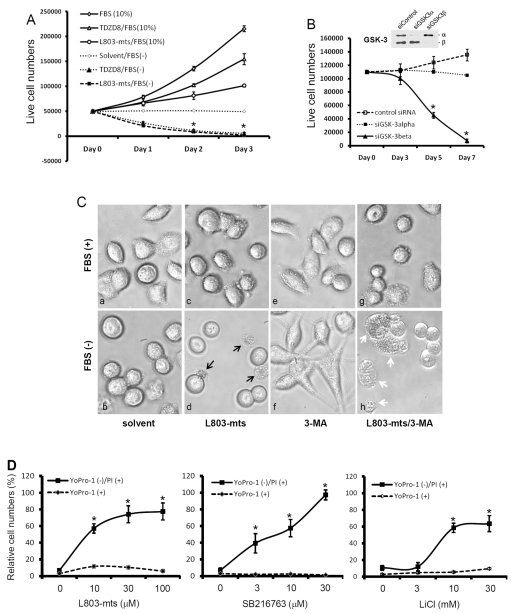
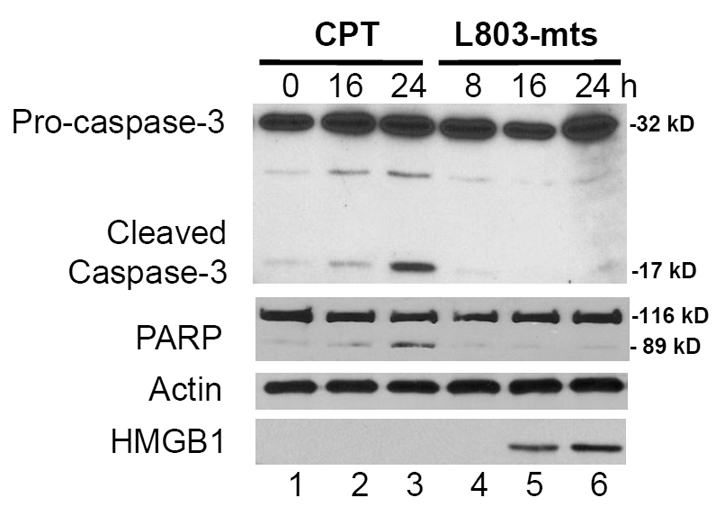
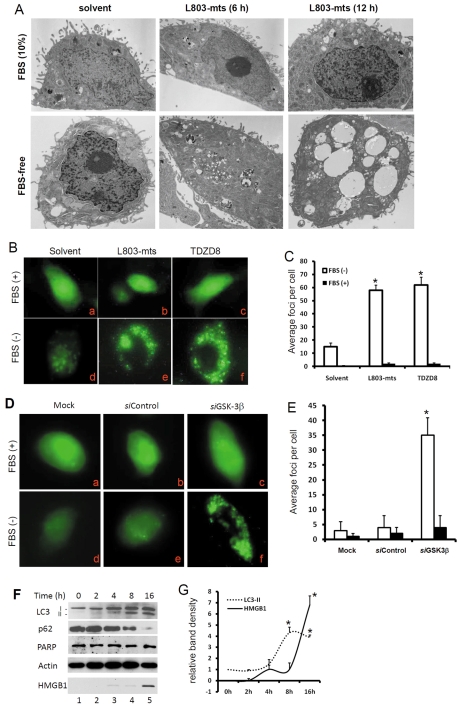
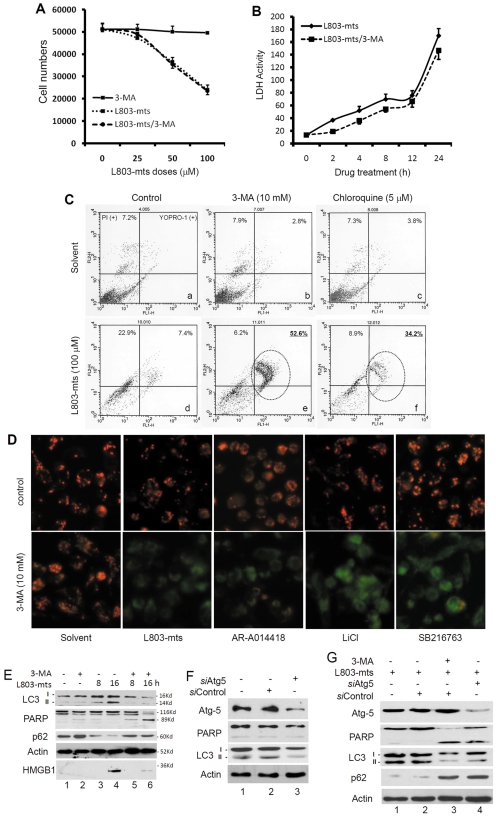
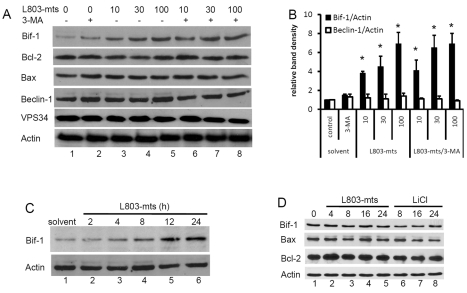
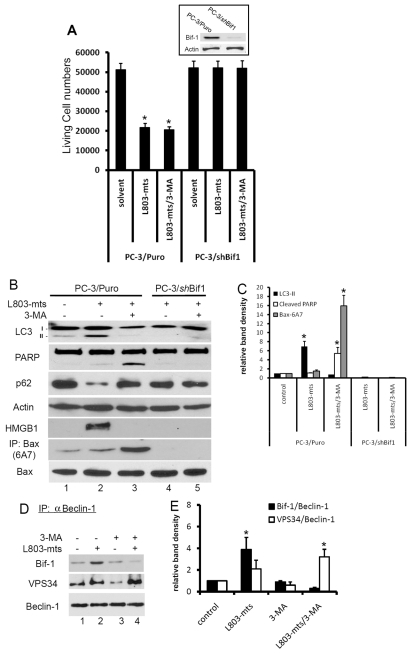
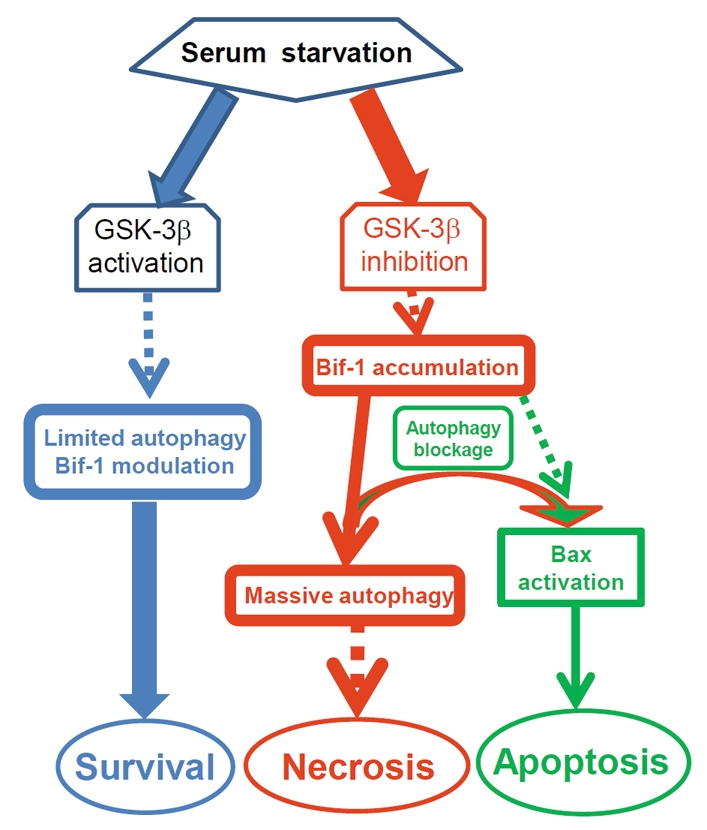
Glycogen synthase kinase 3 beta (GSK-3beta) is constantly active in cells and its activity increases after serum deprivation, indicating that GSK-3beta might play a major role in cell survival under serum starvation. In this study, we attempted to determine how GSK-3beta promotes cell survival after serum depletion. Under full culture conditions (10% FBS), GSK-3beta inhibition with chemical inhibitors or siRNAs failed to induce cell death in human prostate cancer cells. By contrast, under conditions of serum starvation, a profound necrotic cell death was observed as evidenced by cellular morphologic features and biochemical markers. Further analysis revealed that GSK-3beta-inhibition-induced cell death was in parallel with an extensive autophagic response. Interestingly, blocking the autophagic response switched GSK-3beta-inhibition-induced necrosis to apoptotic cell death. Finally, GSK-3beta inhibition resulted in a remarkable elevation of Bif-1 protein levels, and silencing Bif-1 expression abrogated GSK-3beta-inhibition-induced autophagic response and cell death. Taken together, our study suggests that GSK-3beta promotes cell survival by modulating Bif-1-dependent autophagic response and cell death.


Figures

Fig. 1.
Fig. 1.
GSK-3β suppression leads to cell death under serum starvation. (A) PC-3 cells were plated in 12-well plates overnight and then treated with L803-mts (100 μM) or TDZD8 (10 μM) in FBS-supplied or serum-free medium for up to 3 days. At each time points as indicated, live cells were counted using the Trypan Blue exclusion assay as described in our previous publication (Liao et al., 2005). (B) PC-3 cells were transfected with GSK-3 siRNAs or a negative control siRNA mixture, as indicated, at a final concentration of 200 nM in serum-free medium. At each time point, as indicated, cells were counted as above. Inset: proteins were extracted from cells transfected with GSK-3 siRNA or the control siRNA for 3 days, and then subjected to SDS-PAGE and immunoblotting with anti-GSK-3 antibodies. (C) PC-3 cells were plated in 35 mm dishes overnight and then treated with the solvent, L803-mts alone (100 μM), 3-MA alone (10 mM) or L803-mts plus 3-MA in serum-supplied (10% FBS) or serum-free medium. Photomicrographs were taken 24 hours after treatment. Original magnification ×200. Black arrows indicate dead cells with cytolytic features. White arrows indicate collapsed cells without membrane rupture. (D) PC-3 cells were treated with SB216763 at the indicated doses for 3 days, and cell death was assessed by YoPro-1—PI-staining-based flow cytometry assay. In A, B and D data are means ± s.e.m. from three independent experiments. Asterisks indicate significant difference compared with the control (ANOVA analysis, P<0.05).
Fig. 2.
Fig. 2.
GSK-3β inhibitor induces necrotic cell death. PC-3 cells were plated in six-well plates and then treated with camptothecin (CPT; 3.0 μM) or L803-mts (100 μM) in serum-free medium. Equal amount of cellular proteins were used in western blotting to detect caspase processing and PARP cleavage as indicated on the left. Actin was used as a protein loading control. To analyze HMGB-1 release, cell culture media were collected and the supernatants were concentrated using a 3.0-kDa cutoff column. Equal amount of proteins from the concentrated supernatants were subjected to SDS-PAGE followed by immunoblotting with HMGB-1 antibody. The experiment was repeated twice.
Fig. 3.
Fig. 3.
GSK-3β suppression induces strong autophagic response. (A) PC-3 cells were treated with L803-mts (100 μM) or the solvent as control for 6-12 hours under FBS-supplied or serum-free conditions. Transmission electron microscopy was used to evaluate the vacuolization. Note that massive vacuolization was observed in cells after L803-mts treatment under serum-free conditions. (B,C) PC-3 cells stably transfected with GFP-LC3 (PC3/GFP-LC3) were treated with the solvent or L803-mts (100 μM), TDZD8 (10 μM) for 12 hours under serum-supplied (10% FBS) or serum-free conditions. Photomicrographs were taken under a fluorescent microscope at a magnification of ×200. Quantitative data of the average GFP-positive loci per cell are summarized in C. (D,E) PC3/GFP-LC3 cells were transfected with GSK-3β siRNAs (siGSK-3β, 200 nM) or the control siRNA (200 nM) for 48 hours. Cells were then cultured in serum-supplied (10% FBS) or serum-free conditions, as indicated, for 12 hours. Quantitative data of the average GFP-positive loci per cell are summarized in E. (F,G) PC-3 cells were plated in six-well pates and treated with L803-mts (100 μM) under serum-free conditions. Cells were harvested at the indicated time points. Conditioned culture media were collected for HMGB-1 analysis as described earlier. Equal amount of cellular proteins were used in western blotting analysis for LC3 processing, p62 degradation and PARP cleavage. Actin served as a loading control. Quantitative data of band densities are summarized in G. Data are from three experiments and error bars indicate s.e.m. Asterisks indicate a significant difference compared with the control (ANOVA, P<0.01).
Fig. 4.
Fig. 4.
Blocking autophagy flux redirects GSK-3β suppression-induced necrosis to apoptosis. (A) PC-3 cells were plated in 12-well plates and then treated with 3-MA (10 mM), L803-mts (100 μM) or 3-MA plus L803-mts in serum-free conditions for 24 hours. Live cells were counted after Trypan Blue staining, as described earlier. (B) PC-3 cells were plated in 24-well plates and then treated with L803-mts (100 μM) with or without 3-MA (10 mM) under serum-free conditions. Cell culture media were collected at the indicated time points and subjected to LDH assay as described in the text. Data in A and B are means from four independent experiments and error bars indicate s.e.m. (C) PC-3 cells were plated in six-well plates and then treated with L803-mts in serum-free medium in the presence of 3-MA (10 mM), CQ (5 μM) or the solvent for 48 hours. Cells were harvested and stained with YoPro-1 and PI dyes. Representative graphics of cell profiles from the flow cytometry analysis are shown. Note the pattern shift of cell distribution from necrosis (d) to apoptotic death (e and f). (D) PC-3 cells were treated with L803-mts (100 μM), AR-A011418 (3 μM), LiCl (10 mM), SB216763 (30 μM) in the presence of 3-MA (10 mM) or the solvent for 24 hours in serum-free medium. Cells were then stained with JC-1 from a mitochondrial membrane potential assay kit, as described in our previous publication (Liao et al., 2005). Original magnification ×200. (E) PC-3 cells were plated in six-well plates overnight and then treated with L803-mts (100 μM) in serum-free medium for different time periods, as indicated, in the presence or absence of 3-MA (10 mM). Cells were harvested and equal amounts of cellular proteins were used for immunoblotting with antibodies as indicated. HMGB-1 analysis was described earlier. The molecular masses of the bands are indicated on the right side of the blots. (F,G) PC-3 cells were transfected with Atg5 siRNAs (siAtg5; 200 nM) or the negative control siRNA (siControl; 200 nM) for 48 hours, and then left untreated (F) or treated with L803-mts (100 μM) with or without 3-MA (10 mM) in serum-free medium for 18 hours. Equal amounts of proteins from cell lysates were subjected to SDS-PAGE and immunoblotting with the antibodies indicated. Data in C-G are the results from two independent experiments each.
Fig. 5.
Fig. 5.
GSK-3β suppression causes Bif-1 protein accumulation. (A,B) PC-3 cells were left untreated or treated with L803-mts at indicated doses (μM) in the presence or absence of 3-MA (10 mM) for 18 hours in serum-free medium. After harvesting, equal amounts of cellular proteins were subjected to SDS-PAGE and immunoblotting with the indicated antibodies. The relative band densities were normalized against the anti-actin blot and summarized in B. Data are from two separate experiments and error bars indicate the s.e.m. Asterisks indicate significant difference compared with the control (ANOVA, P<0.05). (C) PC-3 cells were treated with the solvent or L803-mts (100 μM) in serum-free medium. Cells were harvested at the indicated time points and Bif-1 protein levels were assessed by western blotting. (D) PC-3 cells were treated with the solvent, L803-mts (100 μM) or LiCl (10 mM) in serum-supplied (FBS, 10%) medium. Cells were harvested at the indicated time points and western blotting was conducted with the primary antibodies as indicated. The anti-actin blot served as a protein loading control.
Fig. 6.
Fig. 6.
Bif-1 is required for GSK-3β-suppression-induced autophagic response and cell death. (A) PC-3/Puro and PC-3/shBif-1 cells were treated with L803-mts (100 μM) with or without 3-MA (10 mM) in serum-free medium for 2 days. Live cells were counted after Trypan Blue staining, as described previously. Inset: exponentially grown PC-3/Puro and PC-3/shBif-1 cells were harvested for western blotting with Bif-1 antibodies. The membrane was re-probed with anti-actin antibody as a loading control. (B,C) PC-3/Puro and PC-3/shBif-1 cells were treated with the solvent or L803-mts (100 μM) plus 3-MA (10 mM) for 16 hours. Cell extracts were subjected to immunoblotting with the antibodies as indicated. To detect Bax conformational change, cellular extracts were prepared in Chaps buffer and then subject to immunoprecipitation with Bax 6A7 antibodies, followed by immunoblotting with regular Bax antibody. Relative band densities were normalized against the anti-actin blot and summarized in C. (D,E) PC-3 cells were treated with L803-mts (100 μM) plus or minus 3-MA (10 mM) in serum-free medium for 18 hours and cellular proteins were subjected to anti-beclin-1 immunoprecipitation and the eluted immunocomplexes were analyzed by western blotting with Bif-1 and VPS34 antibodies, as indicated. Data are from two independent experiments. Relative band densities were shown in E. Asterisks indicate significant difference compared with the control (ANOVA, P<0.05).
Fig. 7.
Fig. 7.
Proposed mechanism of GSK-3β modulation of Bif-1-dependent autophagy and cell death. Blue: under serum starvation conditions, GSK-3β maintains a limited autophagic response for cell survival by modulating the level of Bif-1 protein. Red: once GSK-3β activity is suppressed, Bif-1 protein is increased, resulting in a massive autophagy response and necrotic cell death. Green: if autophagy is blocked, the cell death route is redirected to apoptotic cell death through a mechanism associated with Bif-1-dependent Bax activation.

Similar articles

Cited by

References

    1. Artal-Sanz M., Samara C., Syntichaki P., Tavernarakis N. (2006). Lysosomal biogenesis and function is critical for necrotic cell death in Caenorhabditis elegans. J. Cell Biol. 173, 231-239 - PMC - PubMed
    1. Bhat R., Xue Y., Berg S., Hellberg S., Ormö M., Nilsson Y., Radesäter A. C., Jerning E., Markgren P. O., Borgegård T., et al. (2003). Structural insights and biological effects of glycogen synthase kinase 3-specific inhibitor AR-A014418. J. Biol. Chem. 278, 45937-45945 - PubMed
    1. Boya P., Kroemer G. (2008). Lysosomal membrane permeabilization in cell death. Oncogene 27, 6434-6451 - PubMed
    1. Boya P., González-Polo R. A., Casares N., Perfettini J. L., Dessen P., Larochette N., Métivier D., Meley D., Souquere S., Yoshimori T., et al. (2005). Inhibition of macroautophagy triggers apoptosis. Mol. Cell. Biol. 25, 1025-1040 - PMC - PubMed
    1. Cao C., Subhawong T., Albert J. M., Kim K. W., Geng L., Sekhar K. R., Gi Y. J., Lu B. (2006). Inhibition of mammalian target of rapamycin or apoptotic pathway induces autophagy and radiosensitizes PTEN null prostate cancer cells. Cancer Res. 66, 10040-10047 - PubMed

Publication types

MeSH terms

Substances