

Protocadherin of the liver, kidney, and colon associates with detergent-resistant membranes during cellular differentiation
- PMID: 20159971
- PMCID: PMC2857079
- DOI: 10.1074/jbc.M109.080051
Protocadherin of the liver, kidney, and colon associates with detergent-resistant membranes during cellular differentiation
Abstract
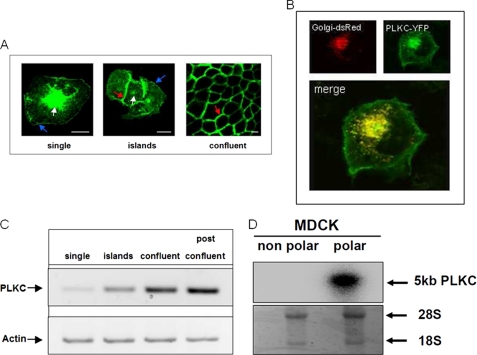
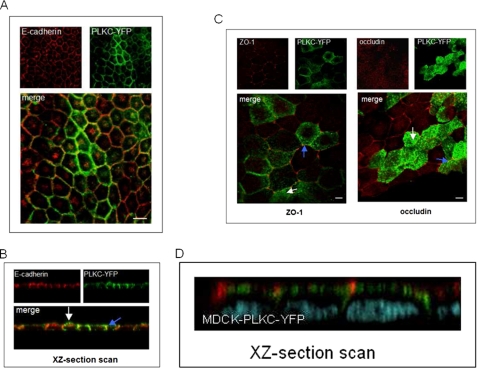
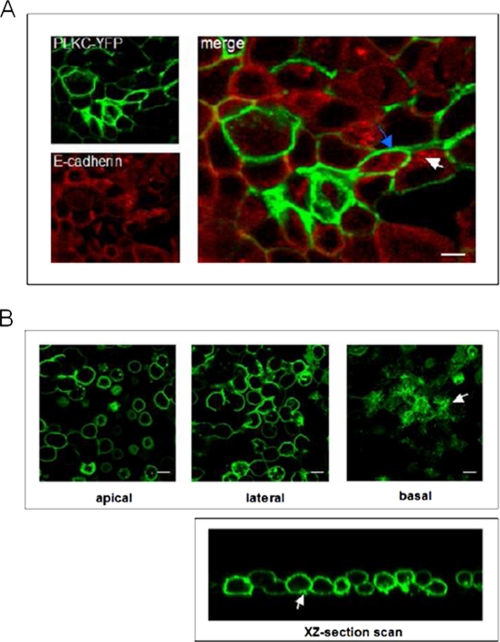
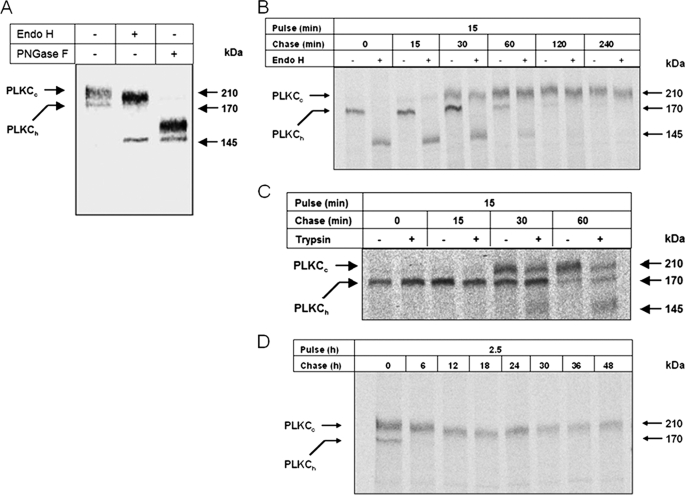
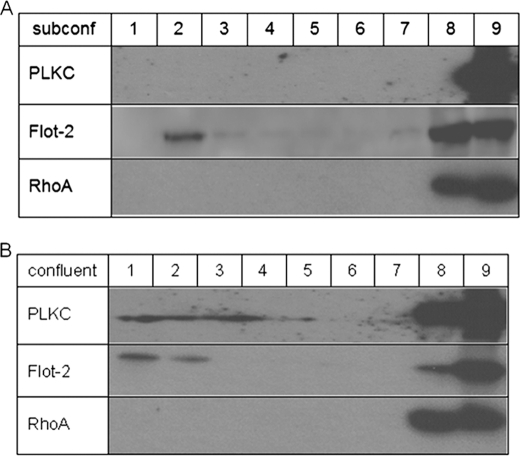
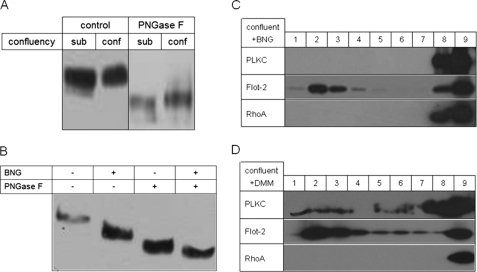
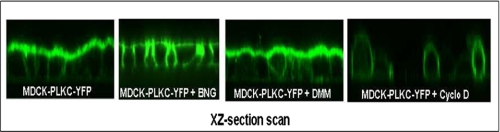
Protocadherin LKC (PLKC) is a member of the heterogeneous subgroup of protocadherins that was identified and described as a potential tumor-suppressor gene involved in contact inhibition (Okazaki, N., Takahashi, N., Kojima, S., Masuho, Y., and Koga, H. (2002) Carcinogenesis 23, 1139-1148 and Ose, R., Yanagawa, T., Ikeda, S., Ohara, O., and Koga, H. (2009) Mol. Oncol. 3, 54-66). Several aspects of the structure, posttranslational processing, targeting, and function of this new protocadherin are still not known. Here, we demonstrate that the expression of PLKC at the apical membrane domain and its concentration at regions of cell-cell contacts occur concomitantly with significant elevation of PLKC-mRNA levels. Furthermore, it can be found within the adherens junctions, but it does not colocalize with tight junctions proteins ZO-1 and occludin, respectively. Additionally, unlike E-cadherin, PLKC is not redistributed upon Ca(2+) removal. Biosynthetic labeling revealed N- and O-glycosylation as posttranslational modifications as well as a fast transport to the cell surface and a low turnover rate. During differentiation, PLKC associates with detergent-resistant membranes that trigger its redistribution from intracellular membranes to the cell surface. This association occurs concomitant with alterations in the glycosylation pattern. We propose a role for PLKC in the establishment of a proper epithelial cell polarity that requires O-linked glycosylation and association of the protein with detergent-resistant membranes.
Figures
Similar articles
-
Hypoglycosylated E-cadherin promotes the assembly of tight junctions through the recruitment of PP2A to adherens junctions.Exp Cell Res. 2010 Jul 1;316(11):1871-84. doi: 10.1016/j.yexcr.2010.02.008. Epub 2010 Feb 13. Exp Cell Res. 2010. PMID: 20156436 Free PMC article.
-
RhoA, Rac1, and Cdc42 exert distinct effects on epithelial barrier via selective structural and biochemical modulation of junctional proteins and F-actin.Am J Physiol Cell Physiol. 2004 Aug;287(2):C327-35. doi: 10.1152/ajpcell.00087.2004. Epub 2004 Mar 24. Am J Physiol Cell Physiol. 2004. PMID: 15044152
-
The Ras target AF-6 interacts with ZO-1 and serves as a peripheral component of tight junctions in epithelial cells.J Cell Biol. 1997 Nov 3;139(3):785-95. doi: 10.1083/jcb.139.3.785. J Cell Biol. 1997. PMID: 9348294 Free PMC article.
-
MicroRNA Regulation of Endothelial Junction Proteins and Clinical Consequence.Mediators Inflamm. 2016;2016:5078627. doi: 10.1155/2016/5078627. Epub 2016 Nov 24. Mediators Inflamm. 2016. PMID: 27999452 Free PMC article. Review.
-
Interplay between tight junctions & adherens junctions.Exp Cell Res. 2017 Sep 1;358(1):39-44. doi: 10.1016/j.yexcr.2017.03.061. Epub 2017 Mar 31. Exp Cell Res. 2017. PMID: 28372972 Free PMC article. Review.
Cited by
-
Heterophilic and homophilic cadherin interactions in intestinal intermicrovillar links are species dependent.PLoS Biol. 2021 Dec 6;19(12):e3001463. doi: 10.1371/journal.pbio.3001463. eCollection 2021 Dec. PLoS Biol. 2021. PMID: 34871294 Free PMC article.
-
Molecular heterogeneity in the choroid plexus epithelium: the 22-member γ-protocadherin family is differentially expressed, apically localized, and implicated in CSF regulation.J Neurochem. 2012 Mar;120(6):913-27. doi: 10.1111/j.1471-4159.2011.07587.x. Epub 2011 Dec 7. J Neurochem. 2012. PMID: 22092001 Free PMC article.
-
Long range epigenetic silencing is a trans-species mechanism that results in cancer specific deregulation by overriding the chromatin domains of normal cells.Mol Oncol. 2013 Dec;7(6):1129-41. doi: 10.1016/j.molonc.2013.08.008. Epub 2013 Aug 30. Mol Oncol. 2013. PMID: 24035705 Free PMC article.
References
Publication types
MeSH terms
Substances
LinkOut - more resources
Full Text Sources
Miscellaneous
