. 2010 Apr 9;285(15):11336-47.
doi: 10.1074/jbc.M109.056457. Epub 2010 Feb 16.

Rapid modulation of the organic anion transporting polypeptide 2B1 (OATP2B1, SLCO2B1) function by protein kinase C-mediated internalization

Affiliations

Rapid modulation of the organic anion transporting polypeptide 2B1 (OATP2B1, SLCO2B1) function by protein kinase C-mediated internalization

Kathleen Köck et al. J Biol Chem. .

Abstract

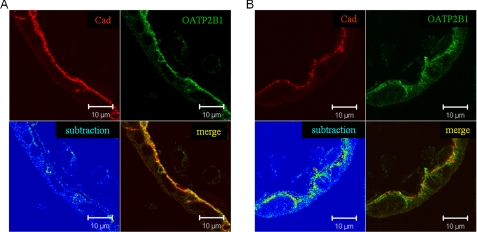
Members of the organic anion transporting polypeptide (OATP) family are involved in various pharmacological, pathophysiological, and physiological processes, such as hepatic drug uptake, progress of cancer, or transport of hormones. Although variability in expression and function of OATPs has been investigated in detail, data concerning regulation are rather limited. Here, we report a novel mechanism for rapid regulation of OATP2B1 mediated by protein kinase C (PKC) resulting in significant changes of transport activity. PKC activation by the phorbol ester (phorbol 12-myristate 13-acetate, PMA) resulted in increased phosphorylation of OATP2B1 as well as reduced OATP2B1 transport activity with a decrease in V(max) of E(1)S uptake (288 +/- 21 (control) versus 165 +/- 16 pmol/min/mg of protein (PMA)). This effect was sensitive to the PKC inhibitor bisindolylmaleimide I (BIM-I). Confocal microscopy, fluorescence-based internalization assay, and live-cell imaging using green fluorescent protein-tagged OATP2B1 revealed that transport inhibition was due to internalization of the transporter. Furthermore, colocalization with LAMP-2 and chloroquine-sensitive degradation of OATP2B1 suggest that the internalized protein is targeted to a lysosomal degradation pathway. With regard to the underlying mechanism inhibition of caveolin/lipid raft-mediated endocytosis failed to prevent OATP2B1 internalization, whereas inhibition of clathrin-mediated processes blocked OATP2B1 sequestration. However, small interfering RNA-mediated clathrin knock-down affected general trafficking of OATP2B1 and resulted in intracellular accumulation in the absence of PMA. In conclusion, our data demonstrate that OATP2B1 function is regulated by PKC-mediated, clathrin-dependent internalization and followed by lysosomal degradation. Furthermore, internalization could be shown in an ex vivo placenta perfusion. Our findings represent a new, rapid mechanism in regulation of human OATPs.


Figures

FIGURE 1.
FIGURE 1.
Influence of PK activation on OATP2B1-mediated E1S uptake. A, uptake of [3H]E1S (0.25 μCi/ml, 1 μm, 5 min) in MDCKII-OATP2B1 cells was determined after a 1-h incubation with solvent (0.1% DMSO), 10 μm forskolin, 100 μm 8-bromo-cAMP (8-Br-cAMP), 100 μm dibutyryl-cAMP (DB-cAMP), and 10 μm PMA at 37 °C. Statistical significance against vehicle-incubated cells was determined by Student's t test. B, concentration dependence of the PMA effect: MDCKII (▴) and MDCKII-OATP2B1 (□) cells were incubated in medium supplemented with increasing concentrations of PMA (10 pm to 10 μm) for 1 h before measuring [3H]E1S uptake. C, time dependence and reversibility of the PMA effect: uptake of [3H]E1S was measured after treatment with 100 nm PMA (■) for 0–26.5 h or after incubation with PMA for 1 h followed by incubation with PMA-free medium (○) (n = 3 of three independent experiments). D, involvement of PKC in down-regulation of OATP2B1-mediated E1S transport: MDCKII-OATP2B1 cells were incubated with the PKC inhibitor BIM-I (1 μm) or control (0.1% DMSO) 20 min prior and during incubation with 100 nm PMA or 0.1% DMSO for 60 min followed by [3H]E1S accumulation assay. Data are shown as percentages of the MDCKII-OATP2B1 cells incubated in the absence of PMA. Data were compared by one-way analysis of variance using Bonferroni's multiple comparison test. Values of all experiments represent mean + S.D., n = 3. **, p < 0.01; *** p < 0.001. n.s., not significant.
FIGURE 2.
FIGURE 2.
PMA-induced internalization of OATP2B1 in MDCKII-OATP2B1 and Caco-2 cells. A–C, MDCKII-OATP2B1 cells were treated with 100 nm PMA for 0 (A), 10 (B), and 60 min (C), fixed, and probed with the OATP2B1/r antibody as described under “Experimental Procedures.” D–F, DMSO (D)- and PMA (E)-treated cells were probed for OATP2B1 (green) and E-cadherin (red) and expression was quantified for plasma membrane and cytosolic localization (F). Values of quantitation are shown as the ratio between intracellular and plasma membrane expression (mean ± S.D., n = 18 cells). ***, p < 0.001. G, time course of PMA-mediated internalization of GFP-tagged OATP2B1 in MDCKII cells. Live-cell confocal imaging implies internalization of the protein after stimulation with 100 nm PMA. Fluorescence of GFP was recorded as described under “Experimental Procedures.” The “zero” time point indicates the addition of PMA to the cell culture medium. Data are representative for at least three independent experiments. The complete time lapse is provided in supplemental Movie 1. H–J, Caco-2 cells were incubated with 100 nm PMA for 0 (H), 30 (I), and 60 min (J), fixed, and probed with the OATP2B1/r antibody. The bar represents 50 μm.
FIGURE 3.
FIGURE 3.
PMA-induced internalization of OATP2B1 in human placenta. Three human placentas were perfused with 100 nm PMA in fetal and maternal circulation as described under “Experimental Procedures.” Paraffin-embedded tissue sections before (A) and after (B) PMA perfusion were probed with the OATP2B1/r and E-cadherin (Cad) antibody (1:200 and 1:1000, respectively). OATP2B1 is given in green, E-cadherin in red. In the merge colocalized pixels of OATP2B1 and E-cadherin are highlighted in yellow. In the subtraction mode, OATP2B1 pixels that colocalized with E-cadherin pixels were subtracted from the original OATP2B1 signal. The resulting OATP2B1 signal is presented in false color from blue to red (low versus high intensity, respectively). Note the strong intracellular signal of OATB2B1 in the subtraction channel after PMA stimulation (B). Data are representative of at least three independent experiments.
FIGURE 4.
FIGURE 4.
Effect of PMA on OATP2B1 phosphorylation. For detection of phosphorylated OATP2B1, MDCKII-OATP2B1 were treated with PMA (100 nm) or DMSO, respectively, and subjected to immunoprecipitation using the OATP2B1/gp antibody. Western blot was probed with an antibody against phospho-Tyr/Thr/Ser and OATP2B1/r. Quantitation of phosphorylation was performed as described under “Experimental Procedures.” Blots are representative for five independent experiments; quantitation data represent the mean + S.D. of all experiments. Wilcoxon signed-rank test was used to determine statistical significance. *, p < 0.05.
FIGURE 5.
FIGURE 5.
Fate of OATP2B1. A, for cell surface biotinylation, MDCKII-OATP2B1 cells were treated with PMA (100 nm) at 37 °C for the indicated times and biotinylated for 1 h at 4 °C. After cell lysis biotinylated proteins were pulled down by Neutravidin-agarose and analyzed for OATP2B1 expression by Western blot (inset). Arbitrary units were calculated from two independent experiments. Data represent mean + S.D. B, fluorescence-based internalization assay: MDCKII-OATP2B1 cells as well as Caco-2 cells were reversibly biotinylated. Following treatment with solvent or PMA (100 nm, 1 h) cell surface biotin was cleaved off using glutathione. After fixation cells were probed with the OATP2B1/r antibody (green) and intracellular biotin was stained with fluorescein isothiocyanate-labeled streptavidin (red) as described under “Experimental Procedures.” C, colocalization with LAMP-2. Immunofluorescence staining of OATP2B1 and LAMP-2 performed in MDCKII-OATP2B1 cells after a 2-h treatment with 100 nm PMA showed partial colocalization of OATP2B1 and LAMP-2 (yellow fluorescence). D, lysosomal degradation of OATP2B1 following PMA treatment. MDCKII-OATP2B1 cells were preincubated with 100 μm chloroquine (CHL), which inhibits lysosomal degradation by increasing the intralysosomal pH, or DMSO for 30 min, before cells were treated with 100 nm PMA or vehicle in the continuous presence of preincubation agent for the time intervals indicated. Afterward, cells were lysed and 50 μg of protein were loaded on a 7.5% SDS-PAGE gel. Representative immunoblots of OATP2B1 in total cell lysates are shown. Glyceraldehyde-3-phosphate dehydrogenase (GAPDH) staining is given for incubation with 100 nm PMA.
FIGURE 6.
FIGURE 6.
Influence of caveolin and clathrin knock-down on OATP2B1 internalization. A, knock-down of clathrin heavy chain and caveolin-1: MDCKII-OATP2B1 cells transfected with or without CHC and Cav1 siRNA for 72 or 48 h, respectively, were lysed and subjected to immunoblot assays. Detection of glyceraldehyde-3-phosphate dehydrogenase (GAPDH) was used as a control for protein loading. B, control as well as Cav1- and CHC-depleted MDCKII-OATP2B1 cells were incubated for 1 h at 37 °C in the presence or absence of PMA (100 nm), fixed, and probed with the OATP2B1/r antibody. Data shown are representative for three independent experiments. The bar represents 20 μm. C, influence of CHC knock-down on function and localization of OATP2B1: MDCKII-OATP2B1 cells were transfected with CHC siRNA and cell surface biotinylation (upper panel) as well as analysis of E1S uptake (lower panel) were performed as described in the legends to Figs. 1A and 4A. Data represent two independent experiments (mean + S.D.).
FIGURE 7.
FIGURE 7.
Inhibition of caveolin- or clathrin-mediated endocytosis on hTfR expression. A, to demonstrate an effect of internalization inhibitors, MDCKII-OATP2B1 cells cotransfected with YFP-tagged transferrin receptor (hTfR) were subjected to chemical or pharmacological treatment influencing endocytotic processes. To inhibit caveolin-mediated endocytosis MDCKII-OATP2B1 cells were incubated with 5 μg/ml of filipin or 25 μm nystatin for 30 min in growth medium; to inhibit clathrin-mediated endocytosis cells were treated with 0.45 m sucrose for 30 min or with 10 mm acetic acid in growth medium for 10 min prior to treatment with PMA (100 nm) or vehicle in the continuous presence of the inhibitors for 1 h. Afterward, cells were fixed and stained with the OATP2B1/r antibody. B, hTfR receptor expression in the plasma membrane and cytosol after treatment with inhibitors of clathrin- and caveolin-mediated endocytosis was quantitated using the LSM510 image browser (mean ± S.D., n = 18 cells). C, colocalization of hTfR and OATP2B1: hTfR-transfected MDCKII-OATP2B1 cells were treated with PMA (100 nm) or DMSO for 1 h and probed with the OATP2B1/r antibody. hTfR is given in red, OATP2B1 in green. Colocalization of both proteins is highlighted in yellow.
FIGURE 8.
FIGURE 8.
Effect of internalization inhibitors on OATP2B1 localization. A, MDCKII-OATP2B1 cells were incubated with 100 nm PMA or DMSO in the presence of internalization inhibitors for 1 h as described in the legend to Fig. 7A. Afterward, cells were fixed and stained with the OATP2B1/r and E-cadherin antibody. E-cadherin is given in red, OATP2B1 in green. The bar represents 10 μm. B, OATP2B1 expression in PMA or control-treated cells was quantified for intracellular accumulation. Values of are given as the ratio between intracellular and plasma membrane expression (mean ± S.D., n = 18 cells). ***, p < 0.001.

Similar articles

Cited by

References

    1. Iwai M., Suzuki H., Ieiri I., Otsubo K., Sugiyama Y. (2004) Pharmacogenetics 14, 749–757 - PubMed
    1. Tirona R. G., Leake B. F., Merino G., Kim R. B. (2001) J. Biol. Chem. 276, 35669–35675 - PubMed
    1. Tachibana-Iimori R., Tabara Y., Kusuhara H., Kohara K., Kawamoto R., Nakura J., Tokunaga K., Kondo I., Sugiyama Y., Miki T. (2004) Drug Metab. Pharmacokinet. 19, 375–380 - PubMed
    1. Deng J. W., Song I. S., Shin H. J., Yeo C. W., Cho D. Y., Shon J. H., Shin J. G. (2008) Pharmacogenet. Genomics 18, 424–433 - PubMed
    1. Link E., Parish S., Armitage J., Bowman L., Heath S., Matsuda F., Gut I., Lathrop M., Collins R. (2008) N. Engl. J. Med. 359, 789–799 - PubMed

Publication types

LinkOut - more resources