. 2010 Apr 16;285(16):11966-73.
doi: 10.1074/jbc.M110.101642. Epub 2010 Feb 16.

Hsp90 directly modulates the spatial distribution of AF9/MLLT3 and affects target gene expression

Affiliations

Hsp90 directly modulates the spatial distribution of AF9/MLLT3 and affects target gene expression

Jeffrey J Lin et al. J Biol Chem. .

Abstract

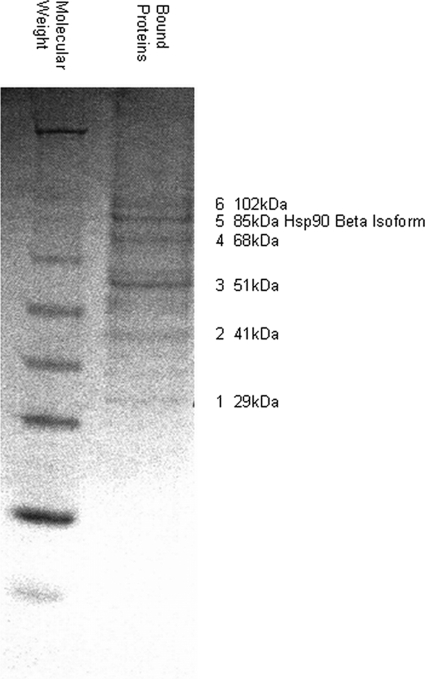
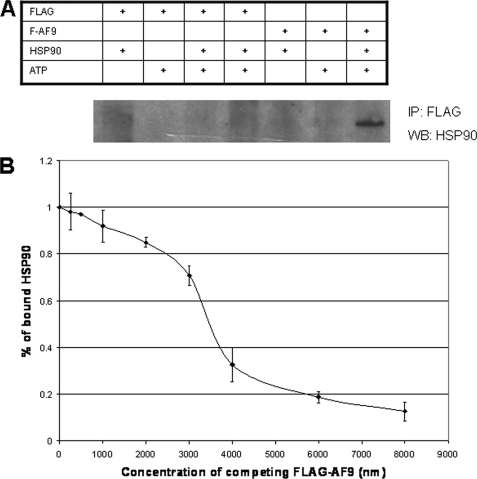
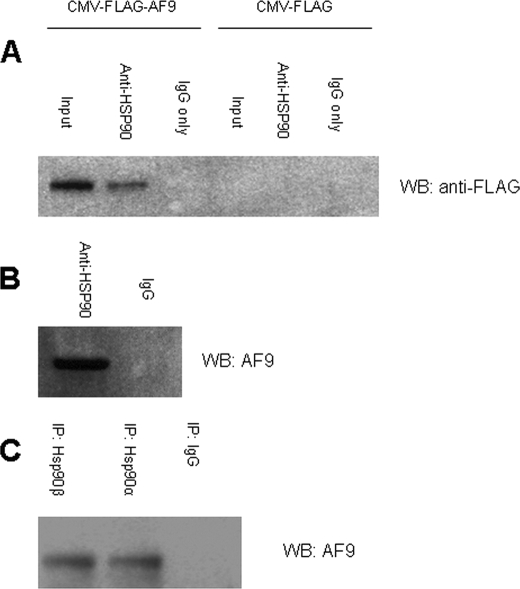
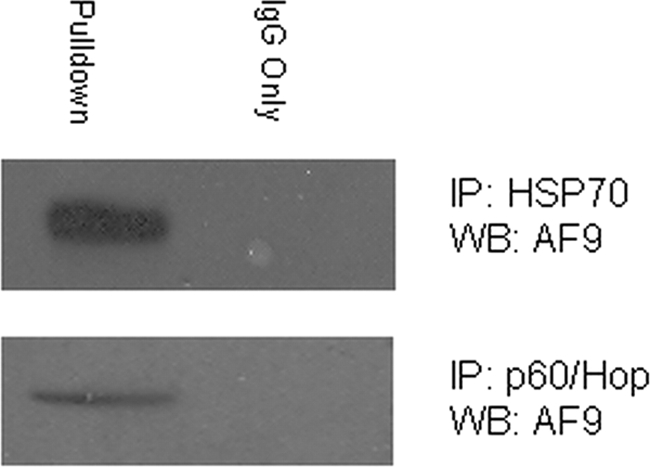
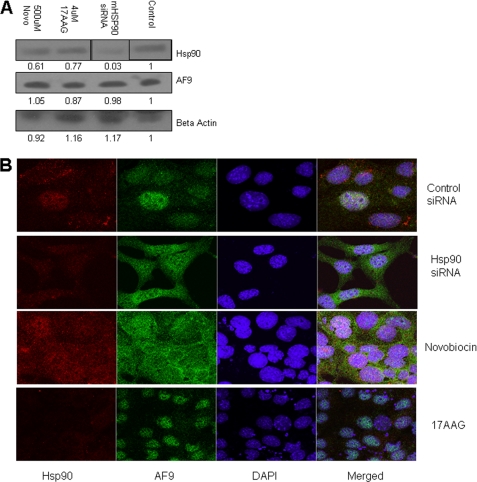
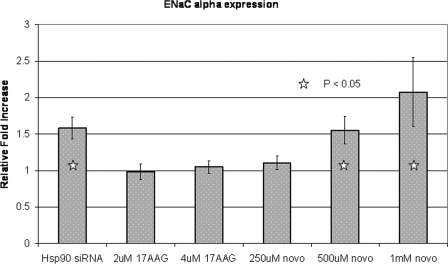
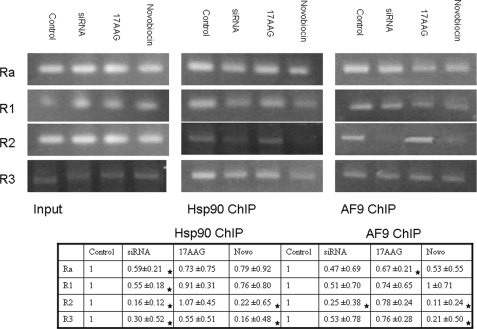
AF9/MLLT3 contributes to the regulation of the gene encoding the epithelial sodium channel alpha, ENaCalpha, in renal tubular cells. Specifically, increases in AF9 protein lead to a reduction in ENaCalpha expression and changes in AF9 activity appear to be an important component of aldosterone signaling in the kidney. Whereas AF9 is found in the nucleus where it interacts with the histone H3 lysine 79 methyltransferase, Dot1, AF9 is also present in the cytoplasm. Data presented in this report indicate that the heat shock protein Hsp90 directly and specifically interacts with AF9 as part of an Hsp90-Hsp70-p60/Hop chaperone complex. Experimental manipulation of Hsp90 function by the inhibitor novobiocin, but not 17-AAG, results in redistribution of AF9 from a primarily nuclear to cytoplasmic location. Knockdown of Hsp90 with siRNA mimics the effect elicited by novobiocin. As expected, a shift in AF9 from the nucleus to the cytoplasm in response to Hsp90 interference leads to increased ENaCalpha expression. This is accompanied by a decrease in AF9 occupancy at the ENaCalpha promoter. Our data suggest that the interaction of Hsp90, Hsp70, and p60/Hop with AF9 is necessary for the proper subnuclear localization and activity of AF9. AF9 is among a growing number of nuclear proteins recognized to rely on the Hsp90 complex for nuclear targeting.


Figures

FIGURE 1.
FIGURE 1.
Isolation of AF9-binding proteins. THP-1 whole cell extract was pre-adsorbed to a FLAG peptide affinity matrix and was then applied to a FLAG-AF9-ct column (amino acids 475–568 of AF9). Bound proteins were eluted with 1 m NaCl and 100 mm glycine. Eluted proteins were separated by SDS-PAGE and stained with Coomassie Brilliant Blue. Bands 1–6 were excised from the gel and identified by mass spectroscopy. The 85-kDa band is the β isoform of Hsp90. The gel shown is the original and only replicate.
FIGURE 2.
FIGURE 2.
In vitro binding of AF9 and Hsp90. A, purified recombinant FLAG-AF9-ct and Hsp90 were used to determine if the proteins interacted directly and in the absence of other factors. FLAG peptide was included as a control. Proteins were incubated in the presence or absence of the non-hydrolyzable ATP analog ATPγS. Proteins were then recovered by anti-FLAG immunoprecipitation and analyzed by Western blot for Hsp90. The Table indicates the composition of the incubation mixture. Hsp90 co-precipitates with FLAG-AF9-ct but only when ATP is present. The figure is representative of three experiments. B, competitive ELISA was used to determine the Kd of the Hsp90 and AF9 interaction. The assay is described under “Experimental Procedures” and uses purified recombinant proteins as in Fig. 2A. Data are derived from three independent experiments. The Kd is ∼3.5 μm. Error bars are the standard deviation from the mean of three replicates.
FIGURE 3.
FIGURE 3.
Co-precipitation of AF9 and Hsp90 in vivo. A, HeLa cells were transfected with CMV-FLAG-AF9 vector expressing full-length AF9 or with the empty vector (CMV-FLAG) as a control. Cell lysates were immunoprecipitated with an antibody that recognizes both Hsp90 isoforms (or IgG control). The precipitated complexes were analyzed by Western blot for FLAG to detect FLAG-tagged AF9. The figure is representative of three experiments. B, non-transfected whole cell lysates were prepared from IMCD3 cells and immunoprecipitated as in Fig. 3A. Endogenous AF9 was detected by Western blot with an AF9 antibody. The figure is representative of three experiments. C, antibodies specific for the α and β isoforms of Hsp90 were used to immunoprecipitate proteins from IMCD3 cells. IgG served as a negative control. Endogenous AF9 was detected by Western blot. The figure is representative of three experiments.
FIGURE 4.
FIGURE 4.
Co-precipitation of AF9 and Hsp70 and the co-chaperone p60/Hop. IMCD3 cell lysates were immunoprecipitated with an Hsp70 antibody (upper panel) or p60/Hop antibody (lower panel). AF9 was detected in the immune complexes by Western blot. The figure is representative of three experiments.
FIGURE 5.
FIGURE 5.
Effects of pharmacologic inhibition and siRNA knock-down of Hsp90 on AF9. A, IMCD3 cells were treated with Hsp90 inhibitors novobiocin (Novo) and 17AAG as well as siRNA directed against both isoforms of mouse Hsp90. Scrambled siRNA served as a control. Whole cell lysates were prepared, and the relative abundance of proteins was assesses by Western blot. siRNA reduces Hsp90 protein abundance. AF9 protein abundance is not affected by any of the interventions. The vertical lines in the Hsp90 Western blot indicate that the position of the lanes was digitally manipulated. Experiment was repeated in triplicate with similar results. B, IMCD3 cells were treated as in Fig. 5A. Cells were then examined by immunofluorescence microscopy with the antibodies and stains indicated in the figure. AF9 shifts from a primarily nuclear localization to a nuclear and cytoplasmic distribution in cells treated with Hsp90 siRNA or novobiocin. The experiment was repeated in triplicate, and data from one set of experiments are shown. Additional images can be furnished upon request.
FIGURE 6.
FIGURE 6.
qPCR for ENaCα gene expression after Hsp90 perturbation. IMCD3 cells were treated with Hsp90 inhibitors or siRNA as described in the text. Total RNA was isolated, reverse transcribed, and quantitative PCR was performed for the mouse ENaCα cDNA. The experiment was repeated in triplicate. Error bars are the standard deviation of the mean from three replicates.
FIGURE 7.
FIGURE 7.
Analysis of the ENaCα promoter region by ChIP. ChIP was performed with Hsp90 and AF9 antibodies and precipitated DNA was amplified by primers spanning the region −1372 to +494 relative to the start site. The primers are described in the text and are derived from the work of Zhang et al. (6) and personal communication with Dr. Zhang. The experiment was repeated in triplicate and fold difference relative to control was calculated using densitometry from the NIH program Image J. The combined data are presented as 95% confidence intervals (CI) of a t distribution of unknown variance. CIs that fall outside the control value of 1.0 are indicated with a star.

Similar articles

Cited by

References

    1. Krivtsov A. V., Twomey D., Feng Z., Stubbs M. C., Wang Y., Faber J., Levine J. E., Wang J., Hahn W. C., Gilliland D. G., Golub T. R., Armstrong S. A. (2006) Nature 442, 818–822 - PubMed
    1. Chen W., Kumar A. R., Hudson W. A., Li Q., Wu B., Staggs R. A., Lund E. A., Sam T. N., Kersey J. H. (2008) Cancer Cell 13, 432–440 - PMC - PubMed
    1. DiMartino J. F., Miller T., Ayton P. M., Landewe T., Hess J. L., Cleary M. L., Shilatifard A. (2000) Blood 96, 3887–3893 - PubMed
    1. Cairns B. R., Henry N. L., Kornberg R. D. (1996) Mol. Cell Biol. 16, 3308–3316 - PMC - PubMed
    1. Nie Z., Yan Z., Chen E. H., Sechi S., Ling C., Zhou S., Xue Y., Yang D., Murray D., Kanakubo E., Cleary M. L., Wang W. (2003) Mol. Cell Biol. 23, 2942–2952 - PMC - PubMed

Publication types

MeSH terms