. 2010 Apr 16;285(16):11958-65.
doi: 10.1074/jbc.M109.059998. Epub 2010 Feb 16.

Three homologous subunits form a high affinity peptide-gated ion channel in Hydra

Affiliations

Three homologous subunits form a high affinity peptide-gated ion channel in Hydra

Stefan Dürrnagel et al. J Biol Chem. .

Abstract

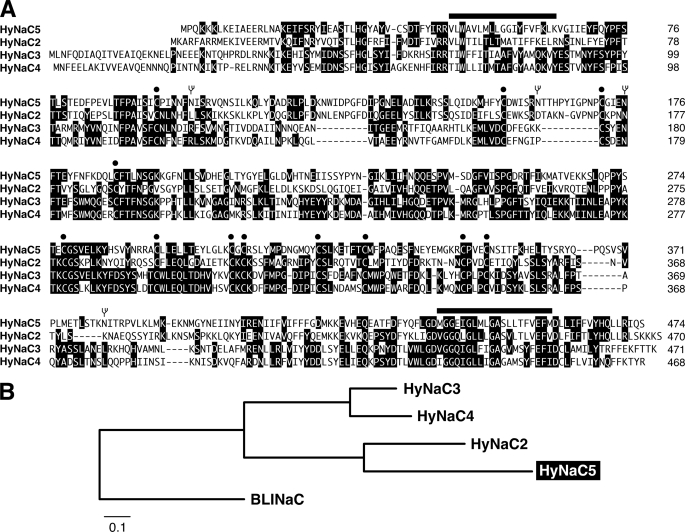
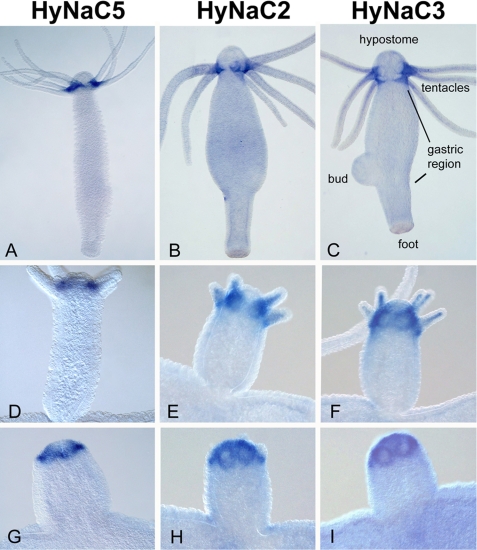
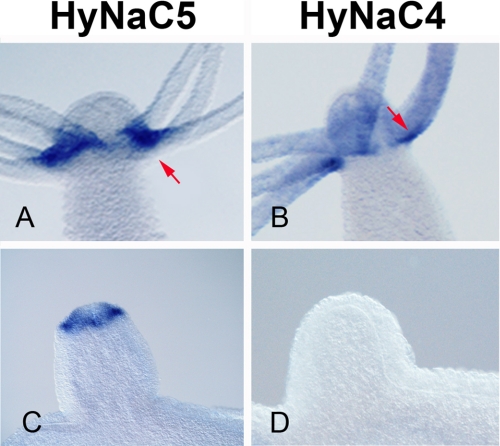
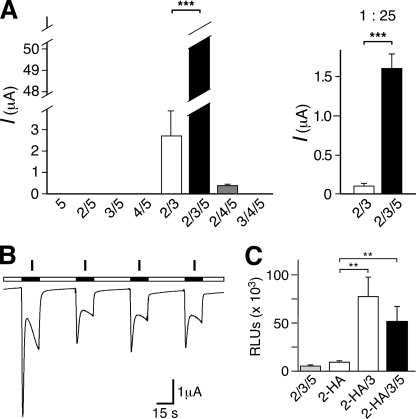
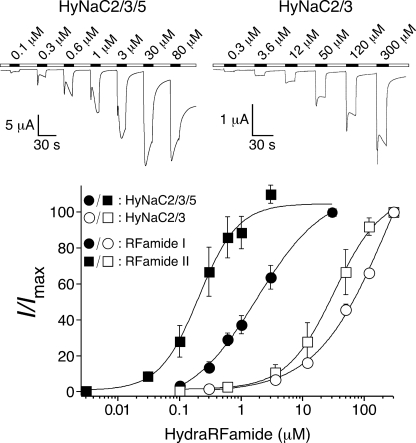
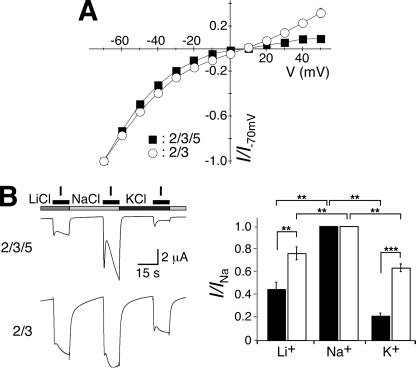
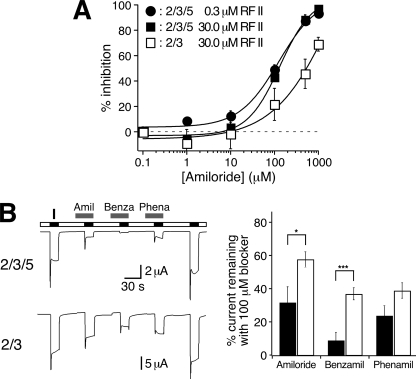
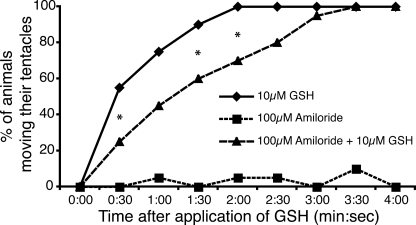
Recently, three ion channel subunits of the degenerin (DEG)/epithelial Na(+) channel (ENaC) gene family have been cloned from the freshwater polyp Hydra magnipapillata, the Hydra Na(+) channels (HyNaCs) 2-4. Two of them, HyNaC2 and HyNaC3, co-assemble to form an ion channel that is gated by the neuropeptides Hydra-RFamides I and II. The HyNaC2/3 channel is so far the only cloned ionotropic receptor from cnidarians and, together with the related ionotropic receptor FMRFamide-activated Na(+) channel (FaNaC) from snails, the only known peptide-gated ionotropic receptor. The HyNaC2/3 channel has pore properties, like a low Na(+) selectivity and a low amiloride affinity, that are different from other channels of the DEG/ENaC gene family, suggesting that a component of the native Hydra channel might still be lacking. Here, we report the cloning of a new ion channel subunit from Hydra, HyNaC5. The new subunit is closely related to HyNaC2 and -3 and co-localizes with HyNaC2 and -3 to the base of the tentacles. Coexpression in Xenopus oocytes of HyNaC5 with HyNaC2 and -3 largely increases current amplitude after peptide stimulation and affinity of the channel to Hydra-RFamides I and II. Moreover, the HyNaC2/3/5 channel has altered pore properties and amiloride affinity, more similarly to other DEG/ENaC channels. Collectively, our results suggest that the three homologous subunits HyNaC2, -3, and -5 form a peptide-gated ion channel in Hydra that could contribute to fast synaptic transmission.


Figures

FIGURE 1.
FIGURE 1.
A, sequence alignment of HyNaC5 with HyNaC2–4. Amino acids showing a high degree of identity are shown as white letters on a black background. The putative positions of transmembrane domains are indicated by bars, conserved cysteines are indicated by circles, and consensus sequences for N-linked glycosylation in HyNaC5 are indicated by branched symbols. Accession numbers are as follows: HyNaC2, AM393878; HyNaC3, AM393880; HyNaC4, AM393881; and HyNaC5, FN257513. B, phylogram illustrating the relationship of HyNaCs. Amino acid sequences of HyNaC2–5 and rat BLINaC were aligned, and the tree for the phylogram was established by Neighbor Joining with ClustalX; highly divergent sequences at the N and C termini had been deleted. Branch lengths are proportional to the evolutionary distance. BLINaC is a related channel (10) that was included for comparison; the accession number of rat BLINaC is Y19034.
FIGURE 2.
FIGURE 2.
hynac5 is expressed at the base of the tentacles. Whole mount in situ hybridization reveals strong expression of hynac5 transcripts at the tentacle base in adult animals (A) and buds (D and G). By comparison hynac2 and hynac3 transcripts are uniformly distributed (B and C). During bud formation, hynac5 transcripts appear as soon as tentacles begin to appear (G) similar to hynac2 and hynac3 (E and F, and H and I). Expression of hynac5 is strongest at the upper side (oral) of the tentacles (A); primary magnifications are 4× (A–C) and 20× (d–I).
FIGURE 3.
FIGURE 3.
hynac5 and hynac4 show complementary expression patterns. hynac5 is expressed at the oral site of the tentacle bases (A) and in early bud (C), whereas hynac4 is expressed at the aboral site of the tentacles (B); it also lacks any expression in early bud stages. Arrows indicate the different expression zones of both genes; primary magnifications are 20× (A–C).
FIGURE 4.
FIGURE 4.
A, HyNaC5 potently increases the current amplitude of the HyNaC2/3 heteromer. Left, bar graphs illustrating the whole oocyte current amplitude after coexpression of different combinations of HyNaC subunits; HyNaCs were activated with 30 μm Hydra-RFamide I. For each condition, a total of ∼8 ng cRNA had been injected in oocytes. Note that the amplitude for HyNaC2/3/5 was >50 μA and therefore only a lower limit of the amplitude can be given. Error bars represent S.E.; for HyNaC2/3/5, the S.E. could not be calculated. n = 10 oocytes. Right, bar graphs illustrating current amplitude of oocytes coexpressing HyNaC2/3 or HyNaC2/3/5; a total of ∼0.3 ng cRNA had been injected. Both channels were activated with a concentration of Hydra-RFamide II eliciting half-maximal response: HyNaC2/3 with 33 μm and HyNaC2/3/5 with 0.35 μm. ***, p < 0.001. B, representative current traces for the HyNaC2/3/5 heteromer. Repeated activation of HyNaC2/3/5 with Hydra-RFamides led to decreased response between the first and second application; in the example shown, 30 μm Hydra-RFamide I was used. cRNA for HyNaCs 2, 3, and 5 was diluted 25-fold (a total of 0.3 ng/oocyte). C, HyNaC5 does not increase surface expression of the HyNaC2/3 heteromer. Surface expression of HyNaC2 and HyNaC2/3 in comparison to HyNaC2/3/5 (mean ± S.E.); only the HyNaC2 subunit was HA-tagged. Oocytes injected with untagged HyNaC2/3/5 served as a control (first column). The results are expressed as relative light units (RLUs)/oocyte/s (n = 16). **, p ≤ 0.01.
FIGURE 5.
FIGURE 5.
HyNaC5 strongly increases apparent affinity for Hydra-RFamides. Top, representative current traces of whole oocytes either expressing HyNaC2 and -3 or HyNaC2, -3, and -5; channels were activated with Hydra-RFamide I. Bottom, concentration-response curves for HyNaC2/3 (open symbols) and HyNaC2/3/5 (closed symbols), each with Hydra-RFamides I (circles) and II (squares). Error bars represent S.E., and lines were fitted to the Hill function. Current amplitudes were normalized to the amplitude obtained with the highest concentration of the ligand (Imax) (n = 8 for HyNaC2/3/5 and n = 4 for HyNaC 2/3).
FIGURE 6.
FIGURE 6.
Ion selectivity of HyNaC2/3/5. A, the HyNaC5 subunit does not change reversal potentials. Channels were activated with 30 μm (HyNaC2/3) or 0.3 μm Hydra-RFamide I (HyNaC2/3/5), respectively, and reversal potentials measured by stepping to the indicated holding potentials for 3 s. B, the HyNaC5 subunit decreases currents carried by K+. Left, representative current traces of whole oocytes either expressing HyNaC2 and -3 or HyNaC2, -3, and -5. Channels were activated in the presence of different monovalent cations. Right, bar graphs illustrating the amplitude of the Li+ and K+ current relative to the Na+ current; black bars represent HyNaC2/3/5, white bars HyNaC2/3. Error bars represent S.E. (12 oocytes); HyNaCs were activated with 30 μm (HyNaC2/3) or 0.3 μm Hydra-RFamide I (HyNaC2/3/5), respectively. In the presence of HyNaC5, amplitudes of Li+ and K+ currents were significantly reduced relative to the amplitude of the Na+ current. **, p < 0.01; ***, p < 0.001, two-tailed t test.
FIGURE 7.
FIGURE 7.
HyNaC5 increases the apparent affinity for amiloride and amiloride analogs. A, concentration response curve for the inhibition of HyNaC currents by amiloride. Curves were determined with 0.3 μm (HyNaC2/3/5) and 30 μm Hydra-RFamide II (HyNaC2/3 and HyNaC2/3/5), respectively (n = five oocytes for HyNaC2/3 and n = 6 oocytes for HyNaC2/3/5). B, left, representative current traces of whole oocytes either expressing HyNaC2 and -3 or HyNaC2, -3, and -5. Channels were activated in the presence of different blockers (100 μm). Right, bar graphs illustrating the current remaining in the presence of the respective blockers; black bars represent HyNaC2/3/5, white bars HyNaC2/3. Before and after application of the blockers, channels were activated without blockers; the mean value of these two measurements was used to normalize the currents obtained in the presence of the blockers. Error bars represent S.E. (six oocytes); HyNaCs were activated with 30 μm (HyNaC2/3) or 1 μm Hydra-RFamide I (HyNaC2/3/5), respectively. In the presence of HyNaC5, amiloride (Aml) and benzamil (Benza) blocked significantly more current, suggesting an increased affinity for these blockers. *, p < 0.05; ***, p < 0.001, two-tailed t test. Phena, phenamil.
FIGURE 8.
FIGURE 8.
Amiloride delays the glutathione induced feeding response. H. magnipapillata were relaxed in plain medium or medium containing 100 μm amiloride. At time 0, glutathione was added to a final concentration of 10 μm. Every 30 s, the number of animals moving their tentacles was recorded. A statistically significant delay in the response to glutathione (GSH) was detected in the presence of amiloride. The calculated p value is < 0.05 as indicated (by an asterisk), whereas it is 0.06 for the time point 1:00.

References

    1. Kellenberger S., Schild L. (2002) Physiol. Rev. 82, 735–767 - PubMed
    1. Ainsley J. A., Pettus J. M., Bosenko D., Gerstein C. E., Zinkevich N., Anderson M. G., Adams C. M., Welsh M. J., Johnson W. A. (2003) Curr. Biol. 13, 1557–1563 - PubMed
    1. Liu L., Johnson W. A., Welsh M. J. (2003) Proc. Natl. Acad. Sci. U.S.A. 100, 2128–2133 - PMC - PubMed
    1. Lin H., Mann K. J., Starostina E., Kinser R. D., Pikielny C. W. (2005) Proc. Natl. Acad. Sci. U.S.A. 102, 12831–12836 - PMC - PubMed
    1. Liu L., Leonard A. S., Motto D. G., Feller M. A., Price M. P., Johnson W. A., Welsh M. J. (2003) Neuron 39, 133–146 - PubMed

MeSH terms

Associated data

LinkOut - more resources