. 2010 Apr 16;285(16):12416-25.
doi: 10.1074/jbc.M109.074211. Epub 2010 Feb 16.

Chemotherapeutic drugs inhibit ribosome biogenesis at various levels

Affiliations

Chemotherapeutic drugs inhibit ribosome biogenesis at various levels

Kaspar Burger et al. J Biol Chem. .

Abstract

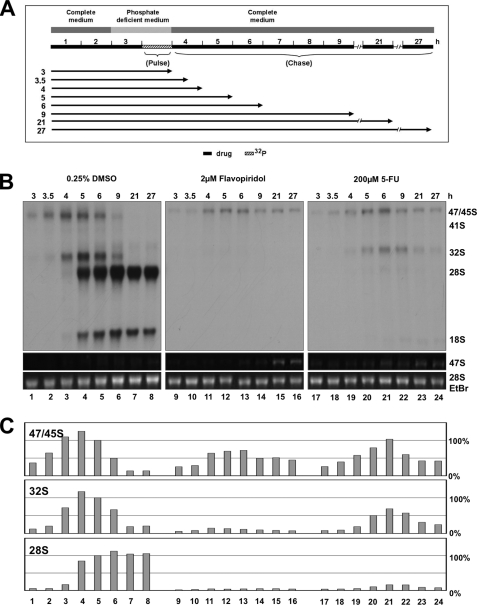
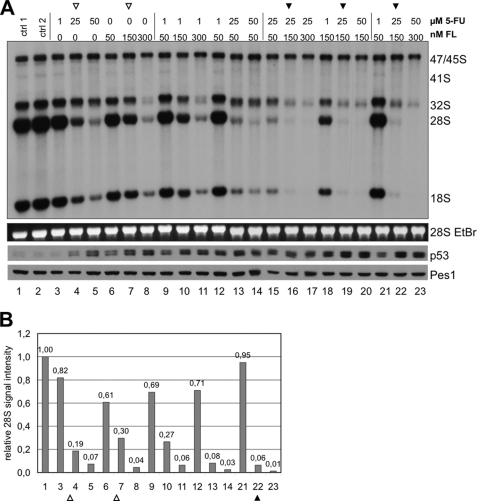
Drugs for cancer therapy belong to different categories of chemical substances. The cellular targets for the therapeutic efficacy are often not unambiguously identified. Here, we describe the process of ribosome biogenesis as a target of a large variety of chemotherapeutic drugs. We determined the inhibitory concentration of 36 chemotherapeutic drugs for transcription and processing of ribosomal RNA by in vivo labeling experiments. Inhibitory drug concentrations were correlated to the loss of nucleolar integrity. The synergism of drugs inhibiting ribosomal RNA synthesis at different levels was studied. Drugs inhibited ribosomal RNA synthesis either at the level of (i) rRNA transcription (e.g. oxaliplatin, doxorubicin, mitoxantrone, methotrexate), (ii) early rRNA processing (e.g. camptothecin, flavopiridol, roscovitine), or (iii) late rRNA processing (e.g. 5-fluorouracil, MG-132, homoharringtonine). Blockage of rRNA transcription or early rRNA processing steps caused nucleolar disintegration, whereas blockage of late rRNA processing steps left the nucleolus intact. Flavopiridol and 5-fluorouracil showed a strong synergism for inhibition of rRNA processing. We conclude that inhibition of ribosome biogenesis by chemotherapeutic drugs potentially may contribute to the efficacy of therapeutic regimens.


Figures

FIGURE 1.
FIGURE 1.
Analysis of rRNA transcription and processing. A, inhibition of rRNA transcription and processing by cytotoxic drugs in metabolic labeling experiments. Cells were cultured with cytostatic drugs, phosphate-depleted, and labeled with [32P]orthophosphate as indicated. B, schematic of rRNA processing in mammalian cells. ETS, external transcribed spacer; ITS, internal transcribed spacer. C, total RNA was isolated, separated by agarose-formaldehyde gel electrophoresis and transferred to a Whatman paper. The signal intensities of all detectable rRNA forms were quantified by phosphorimager analysis. Lane 1 represents a schematic pattern of rRNA of cells with unaffected rRNA synthesis, lanes 2–4 rRNAs of cells after inhibition of rRNA transcription, early rRNA processing, or late rRNA processing.
FIGURE 2.
FIGURE 2.
Cytostatic drugs inhibit rRNA transcription and processing. A–D, cytostatic drugs cisplatin, oxaliplatin, doxorubicin, and mitoxantrone inhibited transcription of rRNA genes. Specific inhibition was demonstrated by a fast and complete decrease of the 47 S/45 S rRNA signal within a small range of concentrations. The signals of the intermediate and mature rRNA forms downstream of the 47 S/45 S transcript decreased concomitantly indicating that rRNA processing is not primarily affected. E–H, cytostatic drugs DRB, roscovitine, MG-132, and homoharringtonine inhibited rRNA processing at various levels. DRB and roscovitine inhibited the occurrence of the 32 S rRNA indicative for inhibition of early processing steps. MG-132 and homoharringtonine inhibited the occurrence of the 18 S and 28 S rRNAs indicative for inhibition of late rRNA processing steps. Green bars indicate mean body concentrations for clinical applications. Ethidium bromide (EtBr)-stained 28 S rRNA served as loading control. Control 1, water; control 2, solvent with highest concentration; control 2*, 1% ethanol; control 3, 0.125% ethanol. I, quantification of signals by phosphorimager, controls were set as 100%.
FIGURE 3.
FIGURE 3.
Inhibition of rRNA processing does inhibit production of 47 S rRNA precursor. A, cells were pulse-labeled for 1 h and chased for various periods of time as indicated. B, autoradiography of labeled rRNAs separated by gel electrophoresis. 47 S rRNA precursor and 28 S rRNA stained by EtBr. C, relative signal intensities determined by phosphorimager. Signals in lane 5 were set as 100%.
FIGURE 4.
FIGURE 4.
Inhibition of rRNA transcription and early rRNA processing, but not late rRNA processing induces nucleoplasmic translocation of NPM. A, methotrexate inhibited transcription of rRNA; B, flavopiridol early rRNA processing steps; C, 5-fluorouracil late rRNA processing steps. A panel of concentrations with increasing inhibitory activity (blue box) was analyzed in parallel for NPM translocation to the nucleoplasm and the ratio of 32 S/28 S rRNA.
FIGURE 5.
FIGURE 5.
Inhibition of rRNA transcription and early rRNA processing, but not late rRNA processing alters the nucleolar localization of NPM, Pes1 and Fib. Cells were treated with inhibitory concentrations of drugs for 6 h, fixed, and cellular localization of the nucleolar proteins nucleophosmin (NPM), pescadillo (Pes1), and fibrillarin (Fib) was determined after immunochemical staining with specific antibodies. Nucleoplasmic translocation of NPM is indicated by an arrow, nucleolar cap structures by arrowheads, and necklace structures by a star. PhC, phase contrast. Pictures for PhC, DAPI, and NPM are taken from the same cell.
FIGURE 6.
FIGURE 6.
5-Fluorouracil and flavopiridol have additive inhibitory effects on rRNA processing. A, cells were treated with 5-FU and FL alone or in combination for 6 h as indicated. Maturation of 28 S rRNA is additively inhibited by 5-FU and FL (filled arrowheads). Levels of p53 induction are determined by Western analysis. EtBr-stained 28 S rRNA and Pes1 served as loading controls. B, quantification of the label of 28 S rRNA signals of A reveals additive inhibition of 28 S rRNA maturation by 5-FU and FL. Signal intensities were determined by phosphorimager and plotted as relative signal intensity normalized to control lane 1.

References

    1. Bunz F., Hwang P. M., Torrance C., Waldman T., Zhang Y., Dillehay L., Williams J., Lengauer C., Kinzler K. W., Vogelstein B. (1999) J. Clin. Invest. 104, 263–269 - PMC - PubMed
    1. Fang F., Hoskins J., Butler J. S. (2004) Mol. Cell. Biol. 24, 10766–10776 - PMC - PubMed
    1. Ghoshal K., Jacob S. T. (1994) Cancer Res. 54, 632–636 - PubMed
    1. Lenz H. J., Manno D. J., Danenberg K. D., Danenberg P. V. (1994) J. Biol. Chem. 269, 31962–31968 - PubMed
    1. Longley D. B., Harkin D. P., Johnston P. G. (2003) Nat. Rev. Cancer 3, 330–338 - PubMed

Publication types

MeSH terms