. 2010 May;54(5):1820-33.
doi: 10.1128/AAC.01521-09. Epub 2010 Feb 16.

Evaluation of standard chemotherapy in the guinea pig model of tuberculosis

Affiliations

Evaluation of standard chemotherapy in the guinea pig model of tuberculosis

Diane J Ordway et al. Antimicrob Agents Chemother. 2010 May.

Abstract

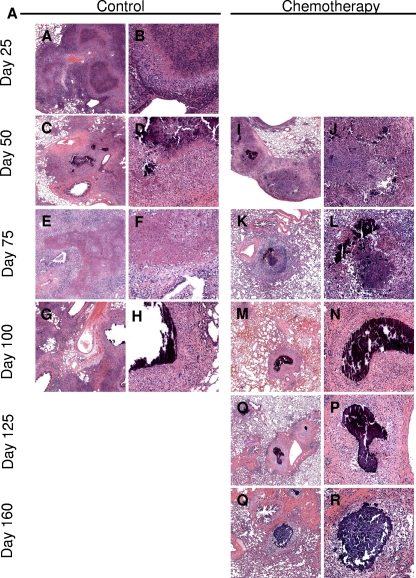
The purpose of this study was 2-fold. First, we evaluated standard chemotherapy in the guinea pig model of tuberculosis to determine if this animal species could productively be used for this purpose. Second, given the similarities of the pathology of disease in guinea pigs and humans, we wished to evaluate additional parameters, including magnetic resonance imaging, microscopy, and cytokine expression and lymphocyte phenotypes, in response to an infection treated with drug therapy. This study shows that conventional rifampin-isoniazid-pyrazinamide chemotherapy significantly decreased the numbers of the highly virulent Erdman K01 strain of Mycobacterium tuberculosis, with most of the bacilli being eliminated in a month. Despite this result, bacteria could still be detected in the lungs and other tissues for at least another 3 to 4 months. Resolution of the nonnecrotic granulomas in the lungs and lymph nodes could be clearly visualized by magnetic resonance imaging at the macroscopic level. Microscopically, the majority of the pulmonary and extrapulmonary inflammation resolved spontaneously, leaving residual lesions composed of dystrophic calcification and fibrosis marking the site of necrosis of the primary lesion. Residual calcified lesions, which were also associated with pulmonary lymphangitis, contained acid-fast bacilli even following aggressive chemotherapy. The presence of intact extracellular bacilli within these lesions suggests that these could serve as the primary sites of disease reactivation. The chemotherapy reduced the level of T-cell influx into infected tissues and was accompanied by a large and sustained increase in TH1 cytokine expression. Chemotherapy also prevented the emergence in lung tissues of high levels of interleukin-10 and Foxp3-positive cells, known markers of regulatory T cells.


Figures

FIG. 1.
FIG. 1.
The bacterial counts in the lungs (A), lymph nodes (B), and spleens (C) from guinea pigs infected with a low dose of M. tuberculosis Erdman K01 and treated with 40% sucrose (solid squares) and receiving chemotherapy (INH, PZA, and RIF; open squares) were compared on days 25, 50, 75, 100, 125, and 150. The results are expressed as the average (n = 5) bacterial load in each group, expressed as the log10 number of CFU (± SEM). It should be noted that the values at later time points are at or below the usual detection limits for these assays, and hence, their accuracy cannot be guaranteed.
FIG. 2.
FIG. 2.
MRI scans of guinea pigs receiving chemotherapy. (A) Numerous granulomas (white nodules) and enlarged lymph nodes (*) on a typical two-dimensional MRI slice from the 3D lung volume of a fixed lung specimen from a control guinea pig (collected at 50 days postinfection); (B) granuloma disease burden (cm3) in treated (solid squares) versus control (solid triangles) animals at the baseline (n = 4) and various other time points (n = 2) determined by MRI analyses of ex vivo lung specimens; (C) lymph node enlargement in treated (solid squares) versus control (solid triangles) animals at various time points determined by MRI analyses of ex vivo lung specimens. PI, postinfection.
FIG. 3.
FIG. 3.
Comparative MRI scans of fixed lung specimens from control guinea pigs and guinea pigs receiving chemotherapy performed on days 29, 50, 78, 105, and 134 of infection. The images obtained by MRI show severe lung consolidation through 100 days postinfection in the control animals compared to the consolidation in the lungs of the animals receiving chemotherapy, which show minimal disease burden.
FIG. 4.
FIG. 4.
Combination drug therapy slows lesion progression in the lungs of M. tuberculosis-infected guinea pigs. Multifocal to coalescing foci of mixed inflammation efface the normal pulmonary architecture by 25 days of infection in control animals receiving sucrose alone (A and B). By day 50 (C, D, I, and J), lesions with central necrosis show evidence of healing by fibrosis and dystrophic calcification, which persists in the primary lesions throughout the course of infection in the control and the drug-treated animals. In the control animals, post-primary lesions efface the remainder of the parenchyma and develop a second phase of lytic necrosis (E and F) that also calcifies in drug-treated animals (K and L). In the drug-treated animals, the post-primary lesions resolve or are prevented from developing, leaving only well-organized calcified lesions that are often perivascular and peribronchial and that correspond to pulmonary lymphatics (M to R), while in the control animals (G and H), the lesions continue to progress to form larger areas of multifocal coalescing inflammation and mineralization that efface large areas of pulmonary parenchyma, resulting in reduced survival. Hematoxylin and eosin staining. Magnifications, ×10 (A to G and I to Q) and ×20 (B to H and J to R).
FIG. 5.
FIG. 5.
Combination drug therapy slows lesion progression in the mediastinal lymph nodes of M. tuberculosis-infected guinea pigs. Extensive foci of mixed inflammation with expansive foci of lytic necrosis efface the normal architecture of the mediastinal lymph nodes in carrier control animals treated with sucrose alone (A to H). By day 50 (A and B), there is partial resolution of the acute inflammation with extensive fibrosis and early evidence of dystrophic calcification of the necrotic lesions. In the late stages of infection (day 75 [E and F] and day 100 [G and H]), residual necrotic foci have incomplete calcification with active inflammation and a second phase of acute inflammation and necrosis. In contrast, lesion necrosis is limited and the lesions fail to progress in drug-treated animals but do progress in the control animals (I to R). Noncalcified lesion necrosis is evident at day 50 (I and J) of infection, but the necrosis heals by fibrosis and incomplete calcification by day 100 (M and N). In contrast to the findings for the control animals, a normal lymph node architecture is partially retained to day 160 (Q and R), by which time all control animals had died due to progressive disease. By day 160 (∼20 days after drug treatment was discontinued), lymph node lesions can again be found to have extensive necrosis that is delineated from the more normal lymph node parenchyma by a thick fibrous capsule. Hematoxylin and eosin staining. Magnifications: ×10 (A to G and I to Q) and ×20 (B to H and J to R).
FIG. 6.
FIG. 6.
Lesion scores from lungs, lymph nodes, and spleens from representative infected guinea pigs receiving chemotherapy at each time point. (A) Lesion scores of lungs, lymph nodes, and spleens for the control animals (C) and the drug-treated animals (D) on days 25, 50, 75, 100, 125 and 150 of infection. The pathology scores are the percentages of the areas of the lungs, lymph nodes, and spleens; and the results are expressed as the ratios of the pathology scores for each parameter. (B) A lung tissue specimen from an M. tuberculosis-infected guinea pig receiving chemotherapy for 125 days. A residual primary lung lesion is evidenced by central necrosis (C) (upper photograph) with dystrophic calcification. The lower photograph depicts the magnified region denoted by the square in the upper photograph showing persisting extracellular acid-fast-staining bacilli (arrows) within the central necrotic core of the primary lesion after treatment.
FIG. 7.
FIG. 7.
CD4 and CD8 T-cell numbers in the lungs, lymph nodes, and blood of guinea pigs during chemotherapy. The numbers of CD4 and CD8 T cells in the lungs, lymph nodes, and blood collected on days 25, 50, 75, 100, 125, and 150 from guinea pigs infected with a low dose of M. tuberculosis Erdman K01 and receiving 40% sucrose treatment (solid squares) or chemotherapy (INH, PZA, and RIF; open squares) were compared. The results are expressed as the mean total number of cells in each tissue expressing CD4 or CD8 (n = 4) per 1.0 g of lung tissue in each group (± SEM).
FIG. 8.
FIG. 8.
Expression of activation markers and homing receptors on CD4 and CD8 T cells in the lungs, lymph nodes, and blood of guinea pigs during chemotherapy. The numbers of CD4 T cells expressing CD45 (A to C), the numbers of CD4 T cells expressing CT4 (D to F), and the numbers of CD8 T cells expressing CT4 cells (G to I) in the lungs, lymph nodes, and blood collected on days 25, 50, 75, 100, 125, and 150 from guinea pigs infected with a low dose of M. tuberculosis Erdman K01 and receiving 40% sucrose treatment (solid squares) or chemotherapy (INH, PZA, and RIF; open squares) were compared. The results are expressed as the average total number of cells expressing CD4 CD45, CD4 CT4, or CD8 CT4 (n = 4) per 1.0 g of each tissue in each group (± SEM).
FIG. 9.
FIG. 9.
MHC class II expression on MR-1 macrophages, B cells, and granulocytes in the lungs, lymph nodes, and blood of guinea pigs during chemotherapy. The numbers of MR-1 macrophages expressing MHC class II (A to C), the numbers of B cells (D to F), and the numbers of MIL4+ granulocytes (G to I) in the lungs, lymph nodes, and blood collected on days 25, 50, 75, 100, 125, and 150 from guinea pigs infected with a low dose of M. tuberculosis Erdman K01 and receiving 40% sucrose treatment (solid squares) or chemotherapy (INH, PZA, and RIF; open squares) were compared. The results are expressed as the average numbers of cells in the lung, lymph node, and blood expressing MHV class II on MR-1 macrophages, B cells, and MIL4+ granulocytes (n = 4) per 1.0 g of tissue in each group (± SEM).
FIG. 10.
FIG. 10.
Cytokine mRNA expression in guinea pig lung cells during chemotherapy. The levels of expression of mRNA for IFN-γ (A), IL-12p40 (B), TNF-α (C), TGF-β (D), IL-10 (E), and Foxp3 (F) in the lung tissues collected on days 25, 50, 100, 125, and 150 from guinea pigs receiving 40% sucrose treatment (solid squares) or chemotherapy (INH, PZA, and RIF; open squares) were compared. Cytokine mRNA expression was quantified by real-time reverse transcription-PCR. The fold induction of mRNA was calculated from the CT values normalized to the CT values for HPRT and then to the values for uninfected guinea pig lung cells. The results are expressed as the average (n = 4) of the fold induction in each group (± SEM).

Comment in

Similar articles

Cited by

References

    1. Allen, S. S., and D. N. McMurray. 2003. Coordinate cytokine gene expression in vivo following induction of tuberculous pleurisy in guinea pigs. Infect. Immun. 71:4271-4277. - PMC - PubMed
    1. Aziz, M. A., A. Wright, A. Laszlo, A. De Muynck, F. Portaels, A. Van Deun, C. Wells, P. Nunn, L. Blanc, and M. Raviglione. 2006. Epidemiology of antituberculosis drug resistance (the Global Project on Anti-Tuberculosis Drug Resistance Surveillance): an updated analysis. Lancet 368:2142-2154. - PubMed
    1. Basaraba, R. J. 2008. Experimental tuberculosis: the role of comparative pathology in the discovery of improved tuberculosis treatment strategies. Tuberculosis (Edinb.) 88(Suppl. 1):S35-S47. - PubMed
    1. Basaraba, R. J., D. D. Dailey, C. T. McFarland, C. A. Shanley, E. E. Smith, D. N. McMurray, and I. M. Orme. 2006. Lymphadenitis as a major element of disease in the guinea pig model of tuberculosis. Tuberculosis (Edinb.) 86:386-394. - PubMed
    1. Basaraba, R. J., A. A. Izzo, L. Brandt, and I. M. Orme. 2006. Decreased survival of guinea pigs infected with Mycobacterium tuberculosis after multiple BCG vaccinations. Vaccine 24:280-286. - PubMed

Publication types

MeSH terms

LinkOut - more resources