. 2010 Mar 2;107(9):4165-9.
doi: 10.1073/pnas.1000620107. Epub 2010 Feb 16.

Transcriptional corepressor TLE1 functions with Runx2 in epigenetic repression of ribosomal RNA genes

Affiliations

Transcriptional corepressor TLE1 functions with Runx2 in epigenetic repression of ribosomal RNA genes

Syed A Ali et al. Proc Natl Acad Sci U S A. .

Abstract

Epigenetic control of ribosomal RNA (rRNA) gene transcription by cell type-specific regulators, such as the osteogenic transcription factor Runx2, conveys cellular memory of growth and differentiation to progeny cells during mitosis. Here, we examined whether coregulatory proteins contribute to epigenetic functions that are mitotically transmitted by Runx2 in osteoblastic cells. We show that the transcriptional corepressor Transducin Like Enhancer-1 (TLE1) associates with rRNA genes during mitosis and interphase through interaction with Runx2. Mechanistically, depletion of TLE1 relieves Runx2-mediated repression of rRNA genes transcription and selectively increases histone modifications linked to active transcription. Biologically, loss of TLE-dependent rRNA gene repression coincides with increased global protein synthesis and enhanced cell proliferation. Our findings reinforce the epigenetic marking target genes by phenotypic transcription factors in mitosis and demonstrate a requirement for retention of coregulatory factors to sustain physiological control of gene expression during proliferation of lineage committed cells.


Conflict of interest statement

The authors declare no conflict of interest.

Figures

Fig. 1.
Fig. 1.
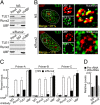
Runx2-mediated repression of rRNA gene expression requires the C terminus. (A) A schematic representation of full-length Runx2 protein indicating the DNA binding runt homology domain (RHD) and the nuclear matrix targeting signal (NMTS). The location of the DNA binding point mutation (R182Q) and the C terminus of ΔC truncation protein is also marked. (B) Real-time qPCR demonstrates relative level of precursor-rRNA (pre-rRNA) and mature-rRNA (m28S-rRNA) in response to WT Runx2, R182Q, and ∆C mutants, normalized to mitochondrial Cytochrome oxidase (mCox). (C) Western blot analysis of SaOS-2 cell lysates demonstrating equivalent levels of the Runx2, R182Q, and ∆C proteins in comparison with empty vector (EV) is shown. CdK2 levels were used as a control for equal protein loading. (D) Represents Ribosomal DNA (rDNA) repeat indicating the Runx2 binding sites (vertical lines) are shown. The position of three primer pairs, A, B, and C, used in this study for ChIP analysis are also shown; arrows indicate positions of primers at rDNA repeat. (E) Chromatin immunoprecipitation (ChIP) assay showing increased rDNA occupancy by the WT Runx2 or ∆C mutant, but not the DNA (R182Q) binding mutant.
Fig. 2.
Fig. 2.
Both HDAC1 and TLE1 exhibit stable expression as cell exit mitosis, but only TLE1 associates with mitotic chromosomes. (A) SaOS-2 cells were blocked in mitosis with Nocodazole (100 ng/mL for 18 h) and released into the cell cycle. Progression of SaOS-2 cells through the cell cycle was analyzed by FACS analysis. Western blot analysis shows the temporal expression of cyclins and the stable expression of TLE1, UBF, HDAC1, Runx2, and the control B23 during different time points of the cell cycle. (B) Immunofluorescence of actively proliferating SaOS-2 cells demonstrates that UBF and Runx2 foci colocalize with TLE1 during different stages of mitosis. White dotted lines mark the nuclear or chromosomal boundaries, whereas the dotted white box indicates region where TLE1 colocalizes with UBF. Arrowheads represent the foci where TLE1 colocalizes with Runx2 and UBF. (C) TLE1 also localizes to NORs at mitotic chromosomes (Left), as assessed by immunofluorescence microscopy of metaphase spreads from mitotically blocked SaOS-2 cells. In contrast, HDAC1 foci do not occupy mitotic NORs with UBF or Runx2 (Right). (D) Chromatin immunoprecipitation analysis shows stable rDNA occupancy of TLE1 and Runx2 during stages of the cell cycle; however, HDAC1 rDNA occupancy is decreased during mitosis and gradually increases as cells progress through the cell cycle.
Fig. 3.
Fig. 3.
Colocalization and interactions of TLE1 and UBF at rDNA repeats. (A) Immunofluorescence microscopy of SaOS-2 cells during interphase demonstrates that TLE1 localizes to nucleolar periphery and colocalizes with UBF. Average percentage colocalization was calculated by counting the number of nucleoli in 25 nuclei. White dotted line demarks the nuclear boundary, whereas the small white dotted square box marks the nucleolus. Also shown are optical sections of a representative cell, taken by focusing the nucleolus at the top (box 1) and capturing sequential images toward the bottom of the cell (box 9). (B) Coimmunoprecipitation assay shows TLE1 interaction with both UBF and Runx2 in SaOS-2 cells during interphase. (C) ChIP-ReChIP assays were carried out by performing primary ChIP with either Runx2 or UBF antibodies, followed by a secondary ChIP (ReChIP) with IgG, TLE1, UBF, or Runx2 antibodies. The results from a representative experiment are shown here in bar graphs of immunoprecipitated chromatin as a percentage of total chromatin. (D) ChIP assays show increased rDNA promoter occupancy of TLE1 in cells expressing the WT Runx2 but not the R182Q or ∆C mutant when compared to empty vector. The rDNA occupancy of UBF did not show significant change with the expression of Runx2 mutants.
Fig. 4.
Fig. 4.
Runx2 mediates interaction of TLE1 with UBF and its rDNA occupancy. (A) Lysate from SaOS-2 cells, transfected with a nonspecific (NS) or Runx2-specific (siRunx2) small interfering RNA oligonucleotides, were subjected to immunoprecipitation (IP). Results show that UBF interaction with TLE1 decreases significantly when Runx2 is depleted from the cells. (B) Immunofluorescence (IF) microscopy reveals that the TLE1 colocalization with UBF at nucleolar periphery decreases in Runx2 knockdown condition when compared to nonspecific (NS) siRNA oligo nucleotide. (C) Depletion of Runx2 also decreases the occupancy of TLE1 on the rDNA repeats when compared to nonspecific (NS) siRNA oligo nucleotide. However, UBF rDNA occupancy remains unaltered by depleting Runx2 as analyzed by ChIP using primer sets A, B, and C. (D) Relative levels of prerRNA are increased in the absence of Runx2 (siRunx2) when compared with nonspecific (NS) siRNA oligo nucleotide as determined by real-time qPCR. Values are obtained by normalizing the rRNA levels with mitochondrial cytochrome oxidase (mCox) levels.
Fig. 5.
Fig. 5.
TLE1 is required for Runx2-mediated rRNA genes suppression. (A) Real-time qPCR shows that pre-rRNA levels are increased when TLE1 is depleted from cells. Western blots demonstrate specific down-regulation of TLE1 by three different siRNA oligonucleotides (1, 2, and 3). (B) Expression of Runx2 in the presence of a TLE1-specific siRNA does not alter pre-rRNA levels as assessed by qPCR. Western blot shows the knockdown of TLE1 protein in the presence and absence of Runx2 expression. (C) Western blot shows specific down-regulation of TLE1 alone or TLE1 with Runx2 by using siRNA oligonucleotides. (D) Chromatin immunoprecipitation assay demonstrates an increase in active histone modifications on rDNA repeats by knocking down either TLE1 alone or in combination with Runx2. (E) Line graphs represent cell count when either TLE1 or both Runx2 and TLE1 are down-regulated by specific siRNA oligonucleotides. Results indicate that the absence of TLE1 or TLE1 and Runx2 increases cell number. (F) Radioactive metabolic labeling with [35S] methionine shows TLE1 and Runx2 negatively regulate the rate of protein synthesis. Line scan was performed on individual lanes to show the difference in protein synthesis rate. Coomassie stain shows that equal protein samples were loaded in each lane.

Similar articles

Cited by

References

    1. Enver T, Pera M, Peterson C, Andrews PW. Stem cell states, fates, and the rules of attraction. Cell Stem Cell. 2009;4:387–397. - PubMed
    1. Mellor J, Dudek P, Clynes D. A glimpse into the epigenetic landscape of gene regulation. Curr Opin Genet Dev. 2008;18:116–122. - PubMed
    1. Ruthenburg AJ, Li H, Patel DJ, Allis CD. Multivalent engagement of chromatin modifications by linked binding modules. Nat Rev Mol Cell Biol. 2007;8:983–994. - PMC - PubMed
    1. Martínez-Balbás MA, Dey A, Rabindran SK, Ozato K, Wu C. Displacement of sequence-specific transcription factors from mitotic chromatin. Cell. 1995;83:29–38. - PubMed
    1. Muchardt C, Reyes J-C, Bourachot B, Leguoy E, Yaniv M. The hbrm and BRG-1 proteins, components of the human SNF/SWI complex, are phosphorylated and excluded from the condensed chromosomes during mitosis. EMBO J. 1996;15:3394–3402. - PMC - PubMed

Publication types

LinkOut - more resources