

Cortical activity during motor execution, motor imagery, and imagery-based online feedback
- PMID: 20160084
- PMCID: PMC2840149
- DOI: 10.1073/pnas.0913697107
Cortical activity during motor execution, motor imagery, and imagery-based online feedback
Erratum in
- Proc Natl Acad Sci U S A. 2010 Apr 13;107(15):7113
Abstract
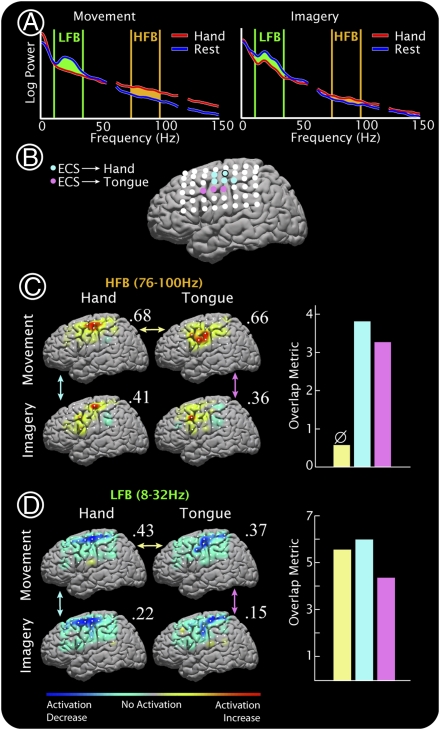
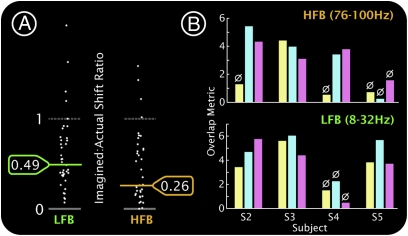
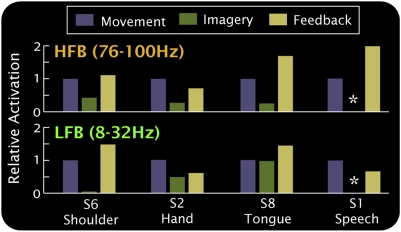
Imagery of motor movement plays an important role in learning of complex motor skills, from learning to serve in tennis to perfecting a pirouette in ballet. What and where are the neural substrates that underlie motor imagery-based learning? We measured electrocorticographic cortical surface potentials in eight human subjects during overt action and kinesthetic imagery of the same movement, focusing on power in "high frequency" (76-100 Hz) and "low frequency" (8-32 Hz) ranges. We quantitatively establish that the spatial distribution of local neuronal population activity during motor imagery mimics the spatial distribution of activity during actual motor movement. By comparing responses to electrocortical stimulation with imagery-induced cortical surface activity, we demonstrate the role of primary motor areas in movement imagery. The magnitude of imagery-induced cortical activity change was approximately 25% of that associated with actual movement. However, when subjects learned to use this imagery to control a computer cursor in a simple feedback task, the imagery-induced activity change was significantly augmented, even exceeding that of overt movement.
Conflict of interest statement
The authors declare no conflict of interest.
Figures
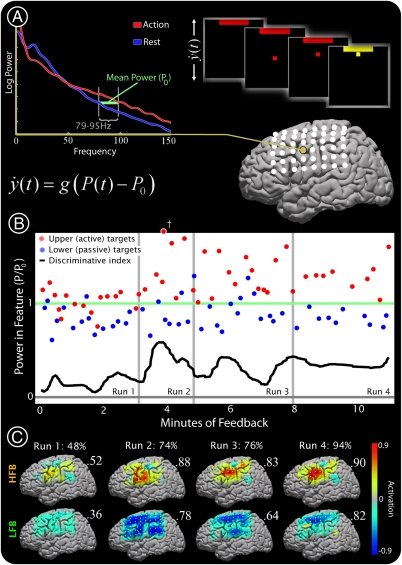
 was derived every 40 ms from the power P(t) at the selected channel and frequency during the previous 280 ms (with respect to mean power, P0). The subject was instructed to imagine saying the word ‘move’ to move the cursor toward one target (“active” target) and to rest (or “idle”) to move the cursor to the other target (“passive” target). (B) The power at the chosen electrode-frequency combination is shown during four consecutive experimental runs of the cursor feedback task. Red dots indicate the mean power during active target trials, and blue dots indicate the mean power during passive target trials (datum noted with a cross represents an outlier lying beyond the upper edge of the plot). The green line denotes P0, the mean power across passive/active trials. The black line indicates a “discriminative index”; i.e., the smoothed difference between the mean power during the previous three active target trials and the previous three passive target trials. This index demonstrates that target accuracies (shown in C) were highest when the subject found a middle dynamic range. After the third run, the subject reported having ceased to perform imagery, and instead “thought about the cursor moving up or down to get it to move” at some point during the run. (C) Distribution of HFB (upper brain plots) and LFB activations, as well as target hit accuracies (% next to run number), during each of the four experimental runs. All activation maps are to the same scale (indicated by the color bar). The final activations are most prominent at the electrode that was used for cursor control. The number flanking each brain plot is the maximum (absolute value) activation.
References
-
- Murphy SM. Imagery interventions in sport. Med Sci Sports Exerc. 1994;26:486–494. - PubMed
-
- Dijkerman HC, Ietswaart M, Johnston M, MacWalter RS. Does motor imagery training improve hand function in chronic stroke patients? A pilot study. Clin Rehabil. 2004;18:538–549. - PubMed
-
- Page SJ, Levine P, Leonard A. Mental practice in chronic stroke: results of a randomized, placebo-controlled trial. Stroke. 2007;38:1293–1297. - PubMed
-
- Alkadhi H, et al. What disconnection tells about motor imagery: evidence from paraplegic patients. Cereb Cortex. 2005;15:131–140. - PubMed
-
- Sharma N, Pomeroy VM, Baron JC. Motor imagery: a backdoor to the motor system after stroke? Stroke. 2006;37:1941–1952. - PubMed
Publication types
MeSH terms
Grants and funding
LinkOut - more resources
Full Text Sources
Other Literature Sources
