. 2010 Mar 2;107(9):4236-41.
doi: 10.1073/pnas.0908725107. Epub 2010 Feb 16.

Cycles, phase synchronization, and entrainment in single-species phytoplankton populations

Affiliations

Cycles, phase synchronization, and entrainment in single-species phytoplankton populations

Thomas M Massie et al. Proc Natl Acad Sci U S A. .

Abstract

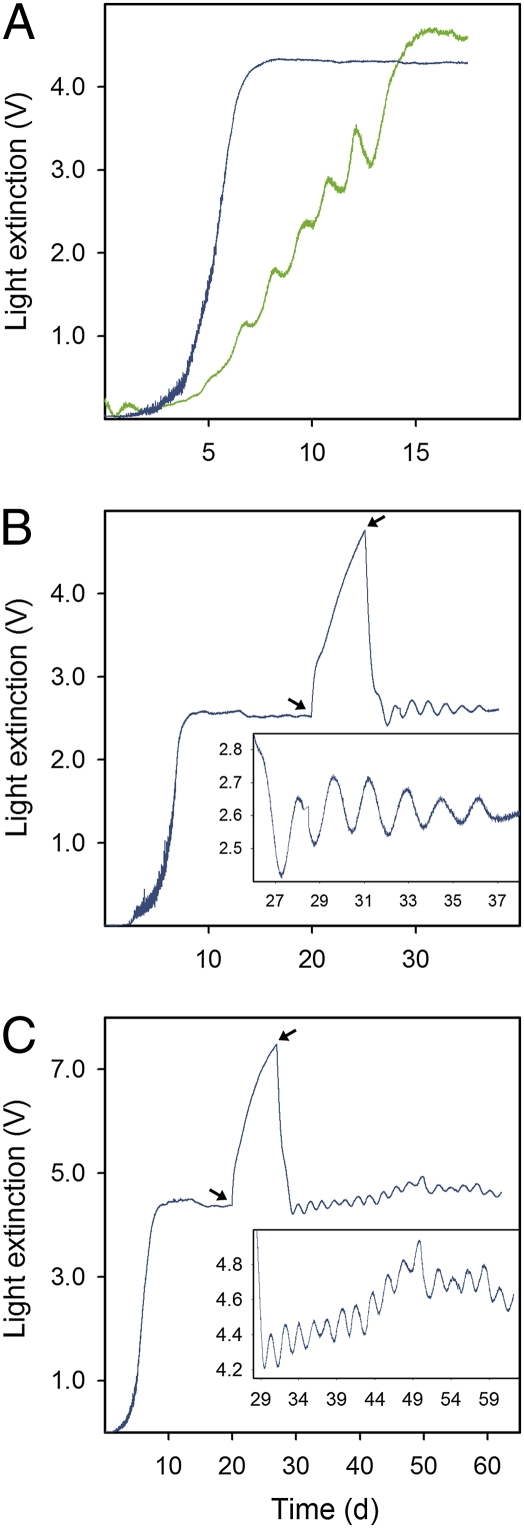
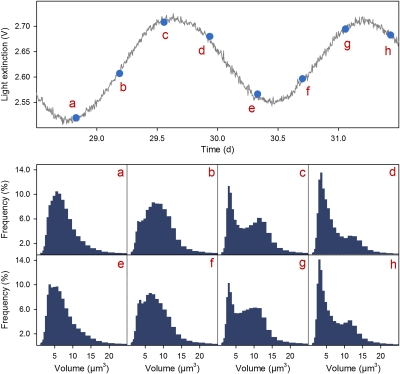
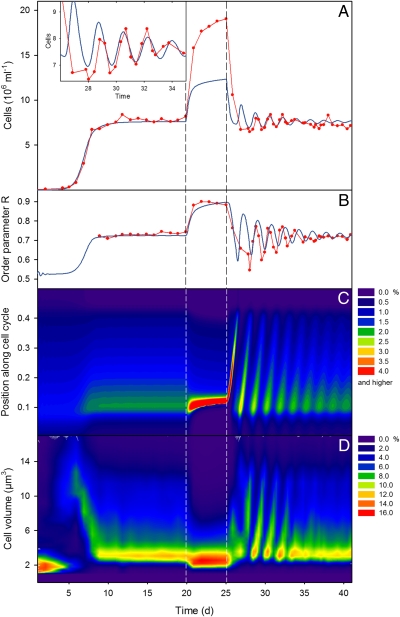
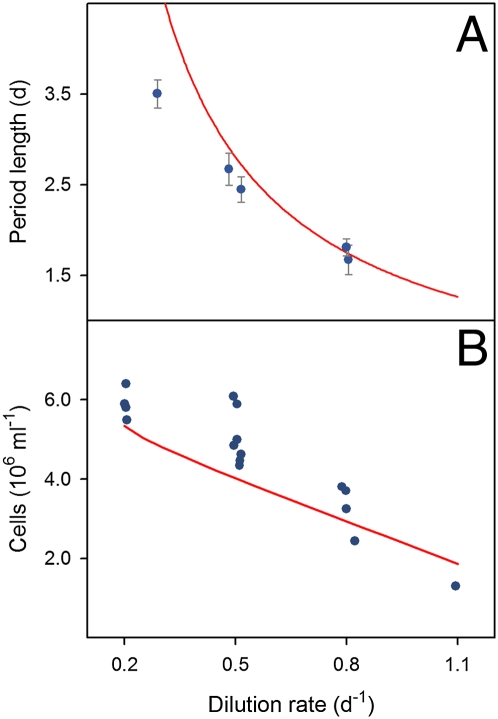
Complex dynamics, such as population cycles, can arise when the individual members of a population become synchronized. However, it is an open question how readily and through which mechanisms synchronization-driven cycles can occur in unstructured microbial populations. In experimental chemostats we studied large populations (>10(9) cells) of unicellular phytoplankton that displayed regular, inducible and reproducible population oscillations. Measurements of cell size distributions revealed that progression through the mitotic cycle was synchronized with the population cycles. A mathematical model that accounts for both the cell cycle and population-level processes suggests that cycles occur because individual cells become synchronized by interacting with one another through their common nutrient pool. An external perturbation by direct manipulation of the nutrient availability resulted in phase resetting, unmasking intrinsic oscillations and producing a transient collective cycle as the individuals gradually drift apart. Our study indicates a strong connection between complex within-cell processes and population dynamics, where synchronized cell cycles of unicellular phytoplankton provide sufficient population structure to cause small-amplitude oscillations at the population level.


Conflict of interest statement

The authors declare no conflict of interest.

Figures

Fig. 1.
Fig. 1.
Oscillatory dynamics in one-species phytoplankton chemostats. Measurements of light extinction [V] are equivalent to algal biovolume (SI Section 2). (A) Smooth and oscillatory increase toward steady state. Chlorella vulgaris (blue) from nitrogen-sufficient culture, δ = 0.65·day−1, Ni = 320 μmol·L−1; Monoraphidium minutum (green) from nitrogen-limited culture, δ = 0.51·day−1, Ni = 160 μmol·L−1. (B) Induced damped oscillations after pausing of chemostat flow. C. vulgaris, δ = 0.0·day−1 from day 20 to 25; otherwise δ = 0.81·day−1, Ni = 160 μmol·L−1. (C) Induced sustained oscillations after pausing of chemostat flow. C. vulgaris, δ = 0.0·day−1 from day 22 to 29; otherwise δ = 0.61·day−1, Ni = 320 μmol·L−1. Arrows indicate when chemostat flow was switched off and back on. Insets show details of the oscillatory part of the dynamics.
Fig. 2.
Fig. 2.
Cell size distributions (Lower) at consecutive phase locations of the population cycle (Upper, detail from chemostat trial with C. vulgaris, Fig. 1B). Letters (AH) indicate locations in the population cycle at which cell size distributions were measured (see text for details).
Fig. 3.
Fig. 3.
Fundamental agreement of oscillatory population behavior and cell cycle phases between experiment and structured model simulation for a chemostat trial with C. vulgaris (compare Fig. 1B). (A) Observed dynamics (red, cell numbers) and model prediction (blue). Inset shows detail of days 26–35. (B) Order parameter R as a simple, direct measure of the degree of synchronization among individual oscillators for the experimental populations (red) and the simulations (blue). (C) Model prediction of cell phase distributions. For each time step color indicates the fraction of the algal population that occupies a certain position along the cell cycle. (D) Observed cell volume distributions as proxy for the cell phase distributions. Color indicates the fraction of the population that has a certain cell volume V (200 bins in 0 μm3V ≤ 4,189 μm3).
Fig. 4.
Fig. 4.
Period lengths and equilibrium densities in chemostat trials with C. vulgaris at different dilution rates. (A) Period length of oscillations arising after “off–on” manipulation of the chemostat. Blue symbols: Mean period length (±1 SD) of oscillations in 5 separate chemostat trials. Red line: Values predicted by simulations of the structured model. Nitrogen concentration of inflowing medium Ni = 160 μmol·L−1 for all trials. (B) Equilibrium cell density reached in 17 separate trials (blue symbols), either before “off–on” manipulation or without such manipulation performed. Red line: Model prediction. Ni = 80 μmol·L−1 for all trials.

References

    1. Strogatz S. Sync: The Emerging Science of Spontaneous Order. New York: Hyperion; 2003.
    1. Pikovsky A, Rosenblum M, Kurths J. Synchronization—A Universal Concept in Nonlinear Sciences. Cambridge, UK: Cambridge Univ Press; 2001.
    1. Winfree AT. On emerging coherence. Science. 2001;298:2336–2337. - PubMed
    1. Taylor AF, Tinsley MR, Wang F, Huang Z, Showalter K. Dynamical quorum sensing and synchronization in large populations of chemical oscillators. Science. 2009;323:614–617. - PubMed
    1. Buck J. Synchronous rhythmic flashing of fireflies. Q Rev Biol. 1988;63:265–289. - PubMed

Publication types