. 2010 Mar 2;107(9):4129-34.
doi: 10.1073/pnas.0908671107. Epub 2010 Feb 16.

Surface-coupled proton exchange of a membrane-bound proton acceptor

Affiliations

Surface-coupled proton exchange of a membrane-bound proton acceptor

Tor Sandén et al. Proc Natl Acad Sci U S A. .

Abstract

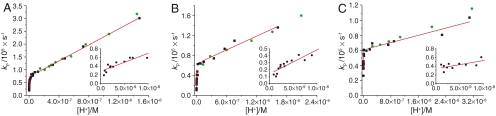
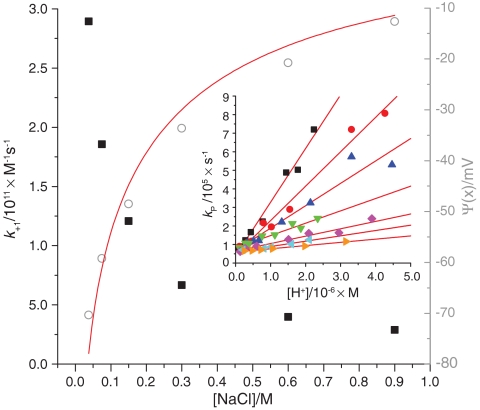
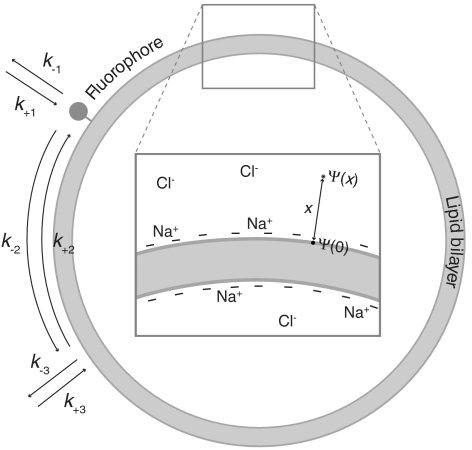
Proton-transfer reactions across and at the surface of biological membranes are central for maintaining the transmembrane proton electrochemical gradients involved in cellular energy conversion. In this study, fluorescence correlation spectroscopy was used to measure the local protonation and deprotonation rates of single pH-sensitive fluorophores conjugated to liposome membranes, and the dependence of these rates on lipid composition and ion concentration. Measurements of proton exchange rates over a wide proton concentration range, using two different pH-sensitive fluorophores with different pK(a)s, revealed two distinct proton exchange regimes. At high pH (> 8), proton association increases rapidly with increasing proton concentrations, presumably because the whole membrane acts as a proton-collecting antenna for the fluorophore. In contrast, at low pH (< 7), the increase in the proton association rate is slower and comparable to that of direct protonation of the fluorophore from the bulk solution. In the latter case, the proton exchange rates of the two fluorophores are indistinguishable, indicating that their protonation rates are determined by the local membrane environment. Measurements on membranes of different surface charge and at different ion concentrations made it possible to determine surface potentials, as well as the distance between the surface and the fluorophore. The results from this study define the conditions under which biological membranes can act as proton-collecting antennae and provide fundamental information on the relation between the membrane surface charge density and the local proton exchange kinetics.


Conflict of interest statement

The authors declare no conflict of interest.

Figures

Fig. 1.
Fig. 1.
Proton exchange rates measured by FCS vs. proton concentration. The insets show the data for pH > 8. (A) Flu-labeled DOPG SUVs (black squares) and OG-labeled DOPG SUVs (green circles) in 0.15 M NaCl, shown for the complete proton concentration range and for pH > 8 (inset). The red lines show linear fits to the proton exchange rates for the Flu data above pH 8 and below pH 7. Above pH 8, the fit yields an apparent protonation second-order rate constant of 4.1 ± 0.7 × 1012 M-1 s-1 and a corresponding deprotonation rate constant of 2.8 ± 0.3 × 104 s-1, and below pH 7, an apparent protonation second-order rate constant of 1.6 ± 0.4 × 1011 M-1 s-1 and a corresponding deprotonation rate constant of 7.2 ± 0.3 × 104 s-1. (B) Flu -labeled DOPG SUVs (black squares) and OG-labeled DOPG SUVs (green circles) in 0.60 M NaCl, shown for the complete proton concentration range and for pH > 8 (inset). The red lines show linear fits to the proton exchange rates for the Flu data above pH 8 and below pH 7. Above pH 8, the fit yields an apparent protonation second-order rate constant of 3.5 ± 0.6 × 1012 M-1 s-1 and a corresponding deprotonation rate constant of 1.4 ± 0.3 × 104 s-1, and below pH 7, an apparent protonation second-order rate constant of 4.6 ± 0.6 × 1010 M-1 s-1 and a corresponding deprotonation rate constant of 6.4 ± 0.5 × 104 s-1. (C) Flu-labeled DOPC SUVs (black squares) and OG-labeled DOPC SUVs (green circles) in 0.15 M NaCl, shown for the complete proton concentration range and for pH > 8 (inset). The red lines show linear fits to the proton exchange rates for the Flu data above pH 8 and below pH 7. Above pH 8, the fit yields an apparent protonation second-order rate constant of 1.9 ± 0.8 × 1012 M-1 s-1 and a corresponding deprotonation rate constant of 3.4 ± 0.4 × 1010 s-1, and below pH 7, an apparent protonation second-order rate constant of 1.2 ± 0.2 × 1010 M-1 s-1 and a corresponding deprotonation rate constant of 6.1 ± 0.4 × 104 s-1.
Fig. 2.
Fig. 2.
Dependence of the protonation rate coefficient with the ion concentration for OG-labeled DOPG SUVs (solid squares). Estimated electrostatic potentials as sensed by OG-labeled DOPG SUVs at 37.5 mM–900 mM NaCl (open circles). Fit to the data using Eqs. 4 and 5 shown as a red line. In this fit, the distance between the surface and the fluorophore, x, was taken as a fitting parameter. Inset: Proton exchange rates measured by FCS vs. proton concentration for OG-labeled DOPG SUVs in an aqueous solution at NaCl concentrations 37.5 mM (black squares), 75 mM (red circles), 150 mM (blue triangles), 300 mM (green triangles), 600 mM (magenta squares), and 900 mM (cyan triangles) and OG-labeled DOPC SUVs in 0.15 M NaCl (orange triangles).
Fig. 3.
Fig. 3.
Schematic model including a membrane surface with a fluorophore, the paths of proton exchange, and the corresponding rate constants.

References

    1. Adam G, Delbrück M. Reduction of dimensionality in biological diffusion processes. In: Rich A, Davidson N, editors. Structural Chemistry and Molecular Biology. Freeman: San Francisco; 1968. pp. 198–215.
    1. Berg HC, Purcell EM. Physics of chemoreception. Biophys J. 1977;20(2):193–219. - PMC - PubMed
    1. Mccloskey MA, Poo MM. Rates of membrane-associated reactions—reduction of dimensionality revisited. J Cell Biol. 1986;102(1):88–96. - PMC - PubMed
    1. Axelrod D, Wang MD. Reduction-of-dimensionality kinetics at reaction-limited cell-surface receptors. Biophys J. 1994;66(3):588–600. - PMC - PubMed
    1. Antonenko YN, Pohl P. Microinjection in combination with microfluorimetry to study proton diffusion along phospholipid membranes. Eur Biophys J Biophys Lett. 2008;37(6):865–870. - PubMed

Publication types

LinkOut - more resources