

Urolithiasis and hepatotoxicity are linked to the anion transporter Sat1 in mice
- PMID: 20160351
- PMCID: PMC2827940
- DOI: 10.1172/JCI31474
Urolithiasis and hepatotoxicity are linked to the anion transporter Sat1 in mice
Abstract
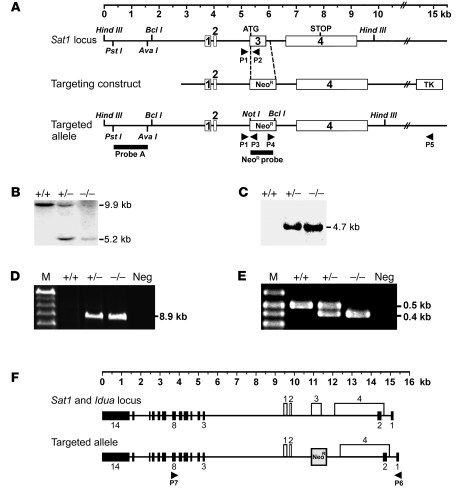
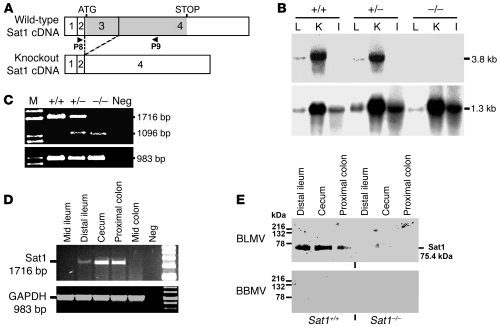
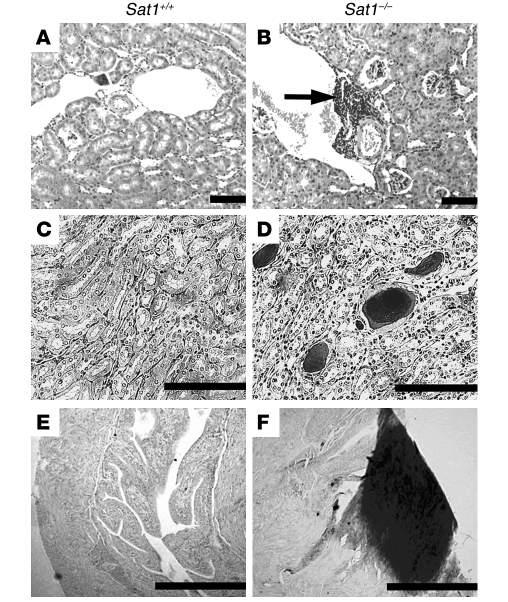
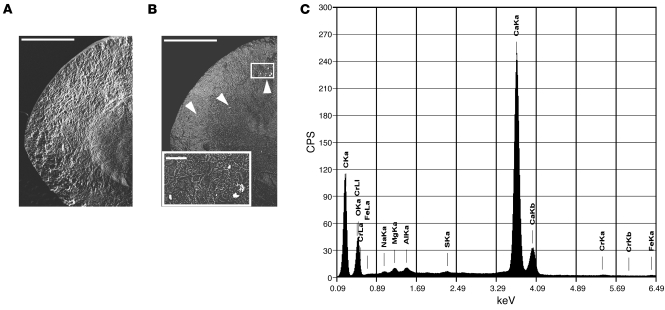
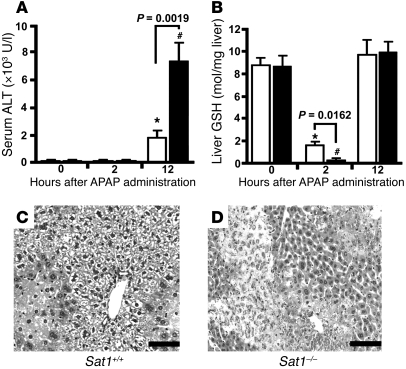
Urolithiasis, a condition in which stones are present in the urinary system, including the kidneys and bladder, is a poorly understood yet common disorder worldwide that leads to significant health care costs, morbidity, and work loss. Acetaminophen-induced liver damage is a major cause of death in patients with acute liver failure. Kidney and urinary stones and liver toxicity are disturbances linked to alterations in oxalate and sulfate homeostasis, respectively. The sulfate anion transporter-1 (Sat1; also known as Slc26a1) mediates epithelial transport of oxalate and sulfate, and its localization in the kidney, liver, and intestine suggests that it may play a role in oxalate and sulfate homeostasis. To determine the physiological roles of Sat1, we created Sat1-/- mice by gene disruption. These mice exhibited hyperoxaluria with hyperoxalemia, nephrocalcinosis, and calcium oxalate stones in their renal tubules and bladder. Sat1-/- mice also displayed hypersulfaturia, hyposulfatemia, and enhanced acetaminophen-induced liver toxicity. These data suggest that Sat1 regulates both oxalate and sulfate homeostasis and may be critical to the development of calcium oxalate urolithiasis and hepatotoxicity.
Figures
Comment in
-
Uro-science.J Urol. 2010 Nov;184(5):2205-6. doi: 10.1016/j.juro.2010.07.013. Epub 2010 Sep 18. J Urol. 2010. PMID: 22520012 No abstract available.
Similar articles
-
Physiological roles of mammalian sulfate transporters NaS1 and Sat1.Arch Immunol Ther Exp (Warsz). 2011 Apr;59(2):113-6. doi: 10.1007/s00005-011-0114-5. Epub 2011 Feb 6. Arch Immunol Ther Exp (Warsz). 2011. PMID: 21298488 Review.
-
Absence of the sulfate transporter SAT-1 has no impact on oxalate handling by mouse intestine and does not cause hyperoxaluria or hyperoxalemia.Am J Physiol Gastrointest Liver Physiol. 2019 Jan 1;316(1):G82-G94. doi: 10.1152/ajpgi.00299.2018. Epub 2018 Nov 1. Am J Physiol Gastrointest Liver Physiol. 2019. PMID: 30383413 Free PMC article.
-
Slc13a1 and Slc26a1 KO models reveal physiological roles of anion transporters.Physiology (Bethesda). 2012 Feb;27(1):7-14. doi: 10.1152/physiol.00041.2011. Physiology (Bethesda). 2012. PMID: 22311966 Review.
-
Physiological roles of renal anion transporters NaS1 and Sat1.Am J Physiol Renal Physiol. 2011 Jun;300(6):F1267-70. doi: 10.1152/ajprenal.00061.2011. Epub 2011 Apr 13. Am J Physiol Renal Physiol. 2011. PMID: 21490138 Review.
-
Sat1 is dispensable for active oxalate secretion in mouse duodenum.Am J Physiol Cell Physiol. 2012 Jul 1;303(1):C52-7. doi: 10.1152/ajpcell.00385.2011. Epub 2012 Apr 18. Am J Physiol Cell Physiol. 2012. PMID: 22517357 Free PMC article.
Cited by
-
The SLC26 gene family of anion transporters and channels.Mol Aspects Med. 2013 Apr-Jun;34(2-3):494-515. doi: 10.1016/j.mam.2012.07.009. Mol Aspects Med. 2013. PMID: 23506885 Free PMC article. Review.
-
Mechanisms of the intestinal and urinary microbiome in kidney stone disease.Nat Rev Urol. 2022 Dec;19(12):695-707. doi: 10.1038/s41585-022-00647-5. Epub 2022 Sep 20. Nat Rev Urol. 2022. PMID: 36127409 Free PMC article. Review.
-
Chronic metabolic acidosis reduces urinary oxalate excretion and promotes intestinal oxalate secretion in the rat.Urolithiasis. 2015 Nov;43(6):489-99. doi: 10.1007/s00240-015-0801-5. Epub 2015 Jul 11. Urolithiasis. 2015. PMID: 26162424
-
Genetics of kidney stone disease.Nat Rev Urol. 2020 Jul;17(7):407-421. doi: 10.1038/s41585-020-0332-x. Epub 2020 Jun 12. Nat Rev Urol. 2020. PMID: 32533118 Review.
-
Bicarbonate Transport During Enamel Maturation.Calcif Tissue Int. 2017 Nov;101(5):457-464. doi: 10.1007/s00223-017-0311-2. Epub 2017 Aug 9. Calcif Tissue Int. 2017. PMID: 28795233 Free PMC article. Review.
References
-
- Markovich D. Physiological roles and regulation of mammalian sulfate transporters. Physiol Rev. 2001;81(4):1499–1533. - PubMed
-
- Falany CN. Enzymology of human cytosolic sulfotransferases. FASEB J. 1997;11(4):206–216. - PubMed
-
- Bissig M, Hagenbuch B, Stieger B, Koller T, Meier PJ. Functional expression cloning of the canalicular sulfate transport system of rat hepatocytes. . J Biol Chem. 1994;269(4):3017–3021. - PubMed
-
- Karniski LP, Lotscher M, Fucentese M, Hilfiker H, Biber J, Murer H. Immunolocalization of sat-1 sulfate/oxalate/bicarbonate anion exchanger in the rat kidney. Am J Physiol. 1998;275(1 Pt 2):F79–F87. - PubMed
Publication types
MeSH terms
Substances
LinkOut - more resources
Full Text Sources
Other Literature Sources
Medical
Molecular Biology Databases
Research Materials
