

Dependence of brain DTI maps of fractional anisotropy and mean diffusivity on the number of diffusion weighting directions
- PMID: 20160677
- PMCID: PMC5719768
- DOI: 10.1120/jacmp.v11i1.2927
Dependence of brain DTI maps of fractional anisotropy and mean diffusivity on the number of diffusion weighting directions
Abstract
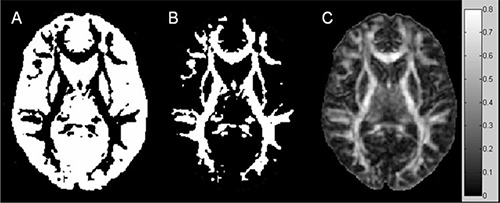
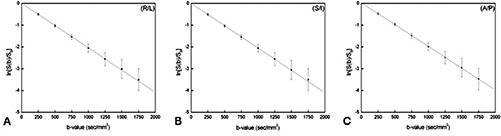
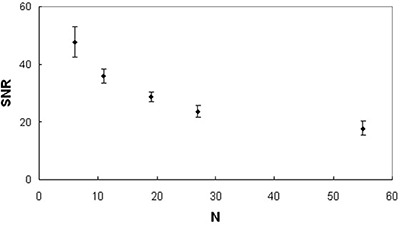
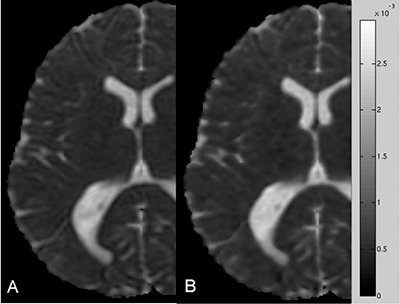
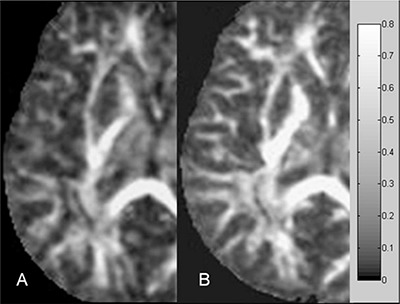
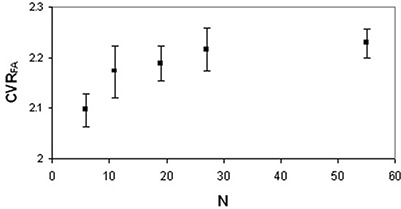
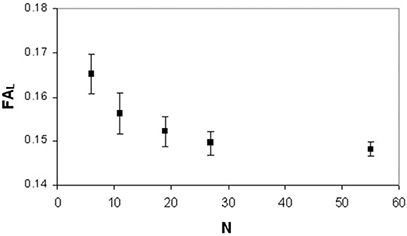
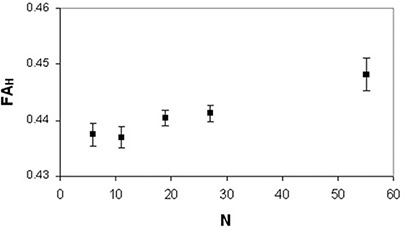
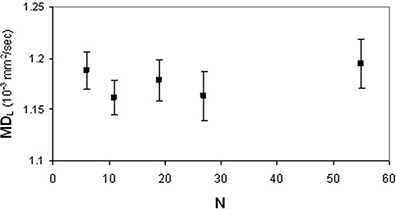
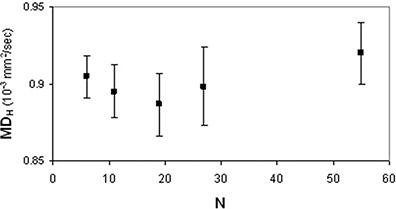
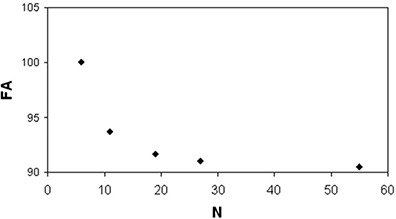
The rotational variance dependence of diffusion tensor imaging (DTI) derived parameters on the number of diffusion weighting directions (N) has been investigated by several Monte Carlo simulation studies. However, the dependence of fractional anisotropy (FA) and mean diffusivity (MD) maps on N, in terms of accuracy and contrast between different anatomical structures, has not been assessed in detail. This experimental study further investigated in vivo the effect of the number of diffusion weighting directions on DTI maps of FA and MD. Human brain FA and MD maps of six healthy subjects were acquired at 1.5T with varying N (6, 11, 19, 27, 55). Then, FA and MD mean values in high (FAH, MDH) and low (FAL, MDL) anisotropy segmented brain regions were measured. Moreover, the contrast-to-signal variance ratio (CVRFA, CVRMD) between the main white matter and the surrounding regions was calculated. Analysis of variance showed that FAL, FAH and CVRFA significantly (p < 0.05) depend on N. In particular, FAL decreased (6%-11%) with N, whereas FAH (1.6%-2.5%) and CVRFA (4%-6.5%) increased with N. MDL, MDH and CVRMD did not significantly (p>0.05) depend on N. Unlike MD values, FA values significantly vary with N. It is noteworthy that the observed variation is opposite in low and high anisotropic regions. In clinical studies, the effect of N may represent a confounding variable for anisotropy measurements and the employment of DTI acquisition schemes with high N (> 20) allows an increased CVR and a better visualization of white matter structures in FA maps.
Figures
Similar articles
-
Differences in Gaussian diffusion tensor imaging and non-Gaussian diffusion kurtosis imaging model-based estimates of diffusion tensor invariants in the human brain.Med Phys. 2016 May;43(5):2464. doi: 10.1118/1.4946819. Med Phys. 2016. PMID: 27147357
-
The role of diffusion tensor imaging and fractional anisotropy in the evaluation of patients with idiopathic normal pressure hydrocephalus: a literature review.Neurosurg Focus. 2016 Sep;41(3):E12. doi: 10.3171/2016.6.FOCUS16192. Neurosurg Focus. 2016. PMID: 27581308 Review.
-
Effects of diffusion weighting schemes on the reproducibility of DTI-derived fractional anisotropy, mean diffusivity, and principal eigenvector measurements at 1.5T.Neuroimage. 2007 Jul 15;36(4):1123-38. doi: 10.1016/j.neuroimage.2007.02.056. Epub 2007 Apr 4. Neuroimage. 2007. PMID: 17532649 Free PMC article.
-
Application of diffusion tensor imaging in brain lesions: A comparative study of neoplastic and non-neoplastic brain lesions.Neurol India. 2018 Nov-Dec;66(6):1667-1671. doi: 10.4103/0028-3886.246270. Neurol India. 2018. PMID: 30504560
-
Diffusion tensor imaging of the roots of the brachial plexus: a systematic review and meta-analysis of normative values.Clin Transl Imaging. 2020;8(6):419-431. doi: 10.1007/s40336-020-00393-x. Epub 2020 Oct 9. Clin Transl Imaging. 2020. PMID: 33282795 Free PMC article. Review.
Cited by
-
Differential callosal contributions to bimanual control in young and older adults.J Cogn Neurosci. 2011 Sep;23(9):2171-85. doi: 10.1162/jocn.2010.21600. Epub 2010 Oct 18. J Cogn Neurosci. 2011. PMID: 20954936 Free PMC article.
-
Investigation of anisotropic fishing line-based phantom as tool in quality control of diffusion tensor imaging.Radiol Phys Technol. 2019 Jun;12(2):161-171. doi: 10.1007/s12194-019-00507-9. Epub 2019 Mar 16. Radiol Phys Technol. 2019. PMID: 30877555
-
Learning Invariant Representations using Inverse Contrastive Loss.Proc AAAI Conf Artif Intell. 2021 Feb;35(8):6582-6591. Epub 2021 May 18. Proc AAAI Conf Artif Intell. 2021. PMID: 34405058 Free PMC article.
-
Diffusion tensor imaging in cubital tunnel syndrome.Sci Rep. 2021 Jul 22;11(1):14982. doi: 10.1038/s41598-021-94211-7. Sci Rep. 2021. PMID: 34294771 Free PMC article.
-
Same Brain, Different Look?-The Impact of Scanner, Sequence and Preprocessing on Diffusion Imaging Outcome Parameters.J Clin Med. 2021 Oct 27;10(21):4987. doi: 10.3390/jcm10214987. J Clin Med. 2021. PMID: 34768507 Free PMC article.
References
-
- Basser PJ, Jones DK. Diffusion‐tensor MRI: theory, experimental design and data analysis – a technical review. NMR Biomed. 2002;15(7‐8):456–67. - PubMed
-
- Kingsley PB, Monahan WG. Contrast‐to‐noise ratios of diffusion anisotropy indices. Magn Reson Med. 2005;53(4):911–18. - PubMed
-
- Le Bihan D, Mangin JF, Poupon C, et al. Diffusion tensor imaging: concepts and applications. J Magn Reson Imaging. 2001;13(4):534–46. - PubMed
-
- Sundgren PC, Dong Q, Gomez‐Hassan D, Mukherji SK, Maly P, Welsh R. Diffusion tensor imaging of the brain: review of clinical applications. Neuroradiology. 2004;46(5):339–50. - PubMed
MeSH terms
LinkOut - more resources
Full Text Sources
Miscellaneous
