. 2010 Mar;28(3):249-55.
doi: 10.1038/nbt.1606. Epub 2010 Feb 14.

Nutrient-sensitized screening for drugs that shift energy metabolism from mitochondrial respiration to glycolysis

Affiliations

Nutrient-sensitized screening for drugs that shift energy metabolism from mitochondrial respiration to glycolysis

Vishal M Gohil et al. Nat Biotechnol. 2010 Mar.

Abstract

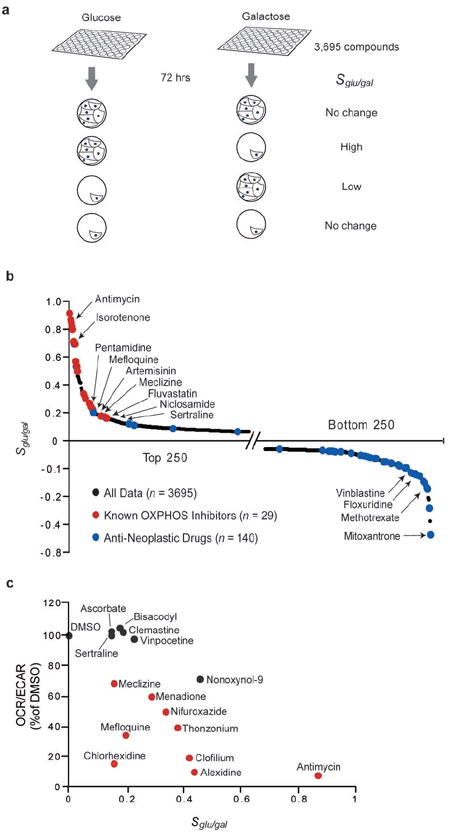
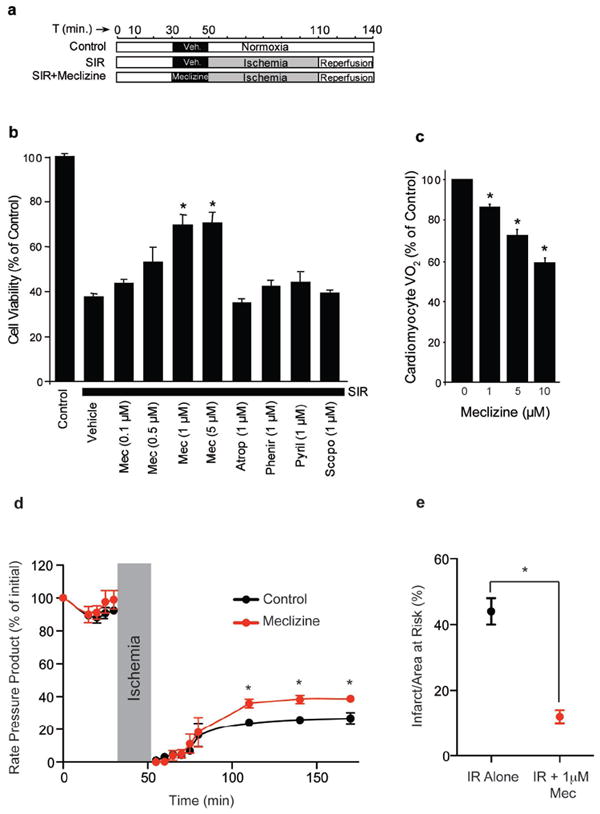
Most cells have the inherent capacity to shift their reliance on glycolysis relative to oxidative metabolism, and studies in model systems have shown that targeting such shifts may be useful in treating or preventing a variety of diseases ranging from cancer to ischemic injury. However, we currently have a limited number of mechanistically distinct classes of drugs that alter the relative activities of these two pathways. We screen for such compounds by scoring the ability of >3,500 small molecules to selectively impair growth and viability of human fibroblasts in media containing either galactose or glucose as the sole sugar source. We identify several clinically used drugs never linked to energy metabolism, including the antiemetic meclizine, which attenuates mitochondrial respiration through a mechanism distinct from that of canonical inhibitors. We further show that meclizine pretreatment confers cardioprotection and neuroprotection against ischemia-reperfusion injury in murine models. Nutrient-sensitized screening may provide a useful framework for understanding gene function and drug action within the context of energy metabolism.


Conflict of interest statement

Competing Financial Interest: VKM, VMG, and SAS are listed as inventors on a patent application filed by the Massachusetts General Hospital.

Figures

Figure 1
Figure 1. Metabolic plasticity of human fibroblasts
(a-b) Schematic representation of cellular energy metabolism pathways. (a) Cells grown in glucose rich media derive ATP from glycolysis as well as from glutamine-driven respiration. (b) Replacing glucose with galactose forces cells to generate ATP almost exclusively from glutamine-driven oxidative metabolism. (TCA = Tricarboxylic Acid; ETC = Electron Transport Chain) (c) Measurement of extracellular acidification rate (ECAR), a proxy for the rate of glycolysis, and oxygen consumption rate (OCR), a proxy for mitochondrial respiration, of fibroblasts grown in 10 mM glucose or 10 mM galactose containing media for three days. Data are expressed as mean ± SD (n=5).
Figure 2
Figure 2. A nutrient sensitized screen to discover agents that shift energy metabolism
(a) Schematic of the drug screen. MCH58 cells grown in 96 well plates in glucose or galactose containing media are exposed to a chemical library of 3695 compounds for 72 hours. The logarithm of the normalized cell number in glucose versus galactose serves as a summary statistic (Sglu/gal) for each compound. (b) Results from a nutrient sensitized screen. Sglu/gal is plotted for top and bottom 250 compounds. Known oxidative phosphorylation (OXPHOS) inhibitors are highlighted in red and anti-neoplastic drugs are highlighted in blue. (c) Secondary assays to evaluate compounds with modest yet positive Sglu/gal scores. The OCR/ECAR ratio of selected compounds is plotted against the compounds’ corresponding Sglu/gal score from panel (b). OCR and ECAR measurements were made on MCH58 cells grown in glucose and are normalized to cell viability. Compounds indicated by red symbols exhibited a statistically significant decrease in the OCR/ECAR ratio based on at least three independent replicates (P<0.05; two-sided t-test).
Figure 3
Figure 3. Effects of meclizine on cellular energy metabolism
(a) Cell viability of MCH58 fibroblasts cells cultured in glucose or galactose media with varying doses of meclizine for three days. Data are expressed as mean ± SD (n = 5). (b) OCR in MCH58 fibroblasts cells cultured in glucose media with varying doses of meclizine for 200 min. Data are expressed as mean ± SD (n = 3). (*P<0.05; **P<0.005; two-sided t-test). (c,d) OCR (c) and ECAR (d) in multiple cell types cultured in glucose media with 50 μM meclizine or DMSO for 200 min. Data are expressed as mean ± SD (n ≥ 3). (* P<0.05; two-sided t-test). (e) Time course of meclizine (50 μM) mediated OCR reduction over DMSO baseline compared to other inhibitors of OXPHOS (1 μM each) in 293 cells. Data are expressed as mean ± SD (n ≥ 3). (f) HIF-1α and HIF-2α detection by Western blot analysis of protein extract from HeLa cells after 6 hrs treatment with 0.1 % DMSO, 100 μM deferoxamine (DFO) or 50 μM meclizine. The complete immunoblot is provided as Supplementary Fig. 7b.
Figure 4
Figure 4. Effect of meclizine on bioenergetics of isolated mitochondria
(a-c) Acute effect of meclizine on oxygen consumption in isolated mitochondria. Traces are representative of five independent measurements. (d) Acute effect of meclizine on mitochondrial membrane potential measured with tetramethyl rhodamine methyl ester (TMRM, 546±7 nm excitation, 590±4 nm emission) in isolated mitochondria. Traces are representative of five independent measurements. (e) Acute effect of meclizine on mitochondrial NADH (370±7 nm excitation, 440±4 nm emission) in isolated mitochondria. Traces are representative of five independent measurements. Mitochondria (Mito), glutamate and malate (G/M), Succinate (S), Pyruvate/Malate (P/M), meclizine (Mec) or DMSO, ADP, and carbonyl cyanide m-chlorophenyl hydrazone (CCCP) were added at indicated time points.
Figure 5
Figure 5. Meclizine is cardioprotective in cellular and ex vivo models of cardiac ischemia
(a) Protocol for the simulated ischemia-reperfusion (SIR) model. (b) Viability of adult rat cardiomyocytes subjected to SIR, in the presence of indicated concentrations of meclizine (Mec), Atropine (Atrop), Pheniramine (Phenir), Pyrilamine (Pyril) and Scopolamine (Scopo). (c) Respiration of cardiomyocytes following exposure to indicated concentrations of meclizine. (d-e) Langendorff perfused rat hearts were subjected to 25 minutes of global ischemia followed by 2 hours of reperfusion. Meclizine treatment comprised infusion of 1μM (Mec) from a port above the aortic cannula for 20 minutes, followed by a 1 minute washout prior to ischemia. (d) Rate pressure product (heart rate × left ventricular developed pressure) is expressed as a % of the initial value throughout the ischemia-reperfusion (IR) protocol. (e) Following IR, hearts were stained with 2,3,5-Triphenyltetrazolium chloride (TTC) and infarct size was quantified. All data are means ± SEM from 4-6 individual experiments. (*P<0.05, ANOVA in panel d, Student’s t-test in panel e).
Figure 6
Figure 6. Meclizine is neuroprotective in a mouse model of stroke
(a) Protocol for the murine model of stroke. Male C57BL/6 mice were treated with two intraperitoneal injections of 100 mg/kg meclizine, 20 mg/kg pyrilamine and 0.5 mg/kg scopolamine or vehicle at 17 and 3 hours prior to 1 hour transient middle cerebral artery occlusion followed by 24 hours of reperfusion. (b) Cerebral blood flow (CBF) measured at baseline and after common carotid and middle cerebral artery occlusion (CCAO and MCAO, respectively) upon treatment with meclizine, scopolamine, pyrilamine or vehicle. Data represent mean ± SD. (c) Infarct volume measured on TTC-stained 1 mm thick coronal slices obtained from mice treated with meclizine, scopolamine, pyrilamine or vehicle. Data points refer to independent experiments, and the solid line represents their mean. (*P<0.05 vs. vehicle and scopolamine, P<0.01 vs. pyrilamine; one-way ANOVA followed by Tukey’s multiple comparison test) (d) Representative images of TTC-stained 1 mm thick coronal brain sections (slice 1-10). (e) Infarct area in the rostrocaudal extent of the brain (slice 1-10) upon treatment with meclizine, scopolamine, pyrilamine or vehicle. Data points represent the mean area of infarction in individual slice levels ± SD in mm2 (n=14 for vehicle, n=8 for meclizine, n=8 for pyrilamine, n=5 for scopolamine, *P<0.05).

Comment in

Similar articles

Cited by

References

    1. Warburg O. On the origin of cancer cells. Science. 1956;123:309–314. - PubMed
    1. Bonnet S, et al. A mitochondria-K+ channel axis is suppressed in cancer and its normalization promotes apoptosis and inhibits cancer growth. Cancer Cell. 2007;11:37–51. - PubMed
    1. Huber R, Spiegel T, Buchner M, Riepe MW. Graded reoxygenation with chemical inhibition of oxidative phosphorylation improves posthypoxic recovery in murine hippocampal slices. J Neurosci Res. 2004;75:441–449. - PubMed
    1. Burwell LS, Nadtochiy SM, Brookes PS. Cardioprotection by metabolic shut-down and gradual wake-up. J Mol Cell Cardiol. 2009;46:804–810. - PMC - PubMed
    1. Chen Q, Camara AK, Stowe DF, Hoppel CL, Lesnefsky EJ. Modulation of electron transport protects cardiac mitochondria and decreases myocardial injury during ischemia and reperfusion. Am J Physiol Cell Physiol. 2007;292:C137–147. - PubMed

Publication types