

Interindividual variations of cerebral blood flow, oxygen delivery, and metabolism in relation to hemoglobin concentration measured by positron emission tomography in humans
- PMID: 20160738
- PMCID: PMC2949226
- DOI: 10.1038/jcbfm.2010.13
Interindividual variations of cerebral blood flow, oxygen delivery, and metabolism in relation to hemoglobin concentration measured by positron emission tomography in humans
Abstract
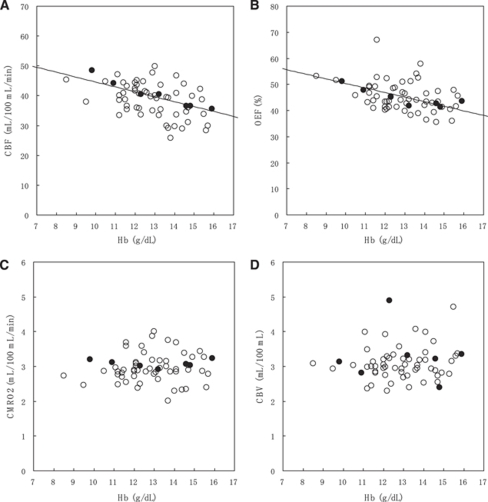
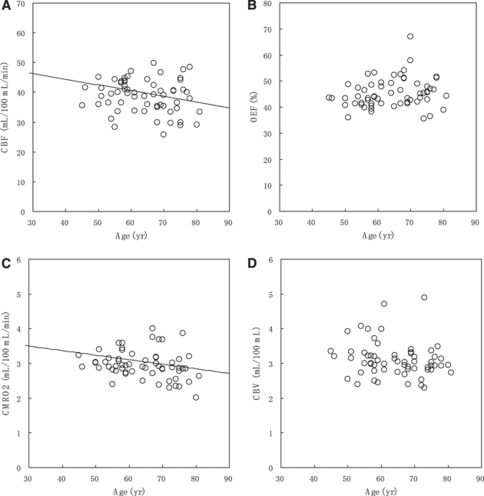
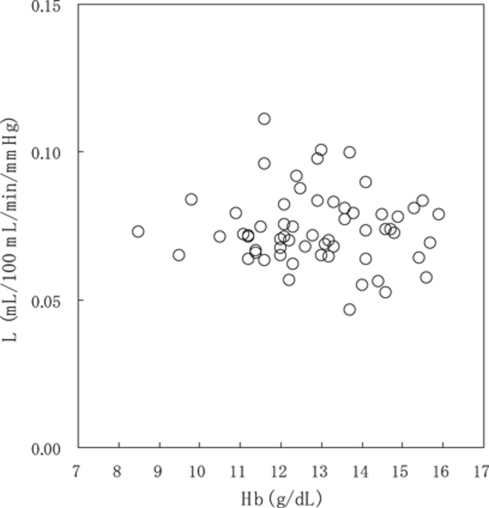
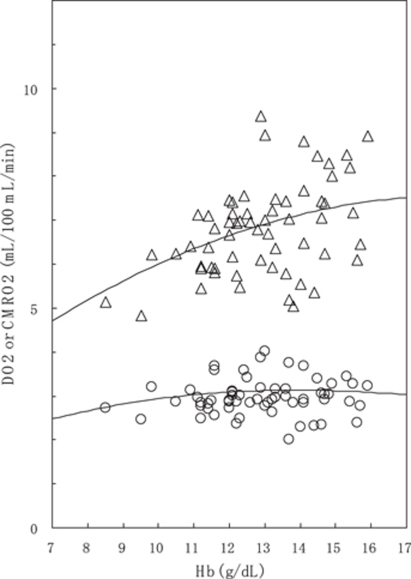
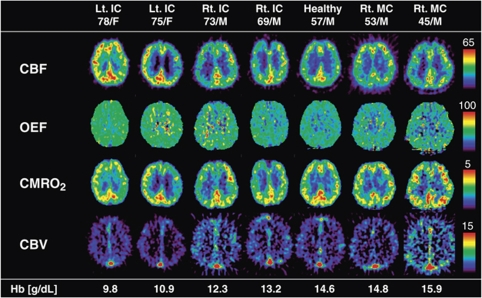
Regional cerebral blood flow (CBF) and oxygen metabolism can be measured by positron emission tomography (PET) with (15)O-labeled compounds. Hemoglobin (Hb) concentration of blood, a primary determinant of arterial oxygen content (C(a)O(2)), influences cerebral circulation. We investigated interindividual variations of CBF, cerebral blood volume (CBV), oxygen extraction fraction (OEF), and cerebral metabolic rate of oxygen (CMRO(2)) in relation to Hb concentration in healthy human volunteers (n=17) and in patients with unilateral steno-occlusive disease (n=44). For the patients, data obtained only from the contralateral hemisphere (normal side) were analyzed. The CBF and OEF were inversely correlated with Hb concentration, but CMRO(2) was independent of Hb concentration. Oxygen delivery defined as a product of C(a)O(2) and CBF (C(a)O(2) CBF) increased with a rise of Hb concentration. The analysis with a simple oxygen model showed that oxygen diffusion parameter (L) was constant over the range of Hb concentration, indicating that a homeostatic mechanism controlling CBF is necessary to maintain CMRO(2). The current findings provide important knowledge to understand the control mechanism of cerebral circulation and to interpret the (15)O PET data in clinical practice.
Figures
References
-
- Brown MM, Marshall J. Regulation of cerebral blood flow in response to changes in blood viscosity. Lancet. 1985;1:604–609. - PubMed
-
- Brown MM, Wade JP, Marshall J. Fundamental importance of arterial oxygen content in the regulation of cerebral blood flow in man. Brain. 1985;108 (Pt 1:81–93. - PubMed
-
- Buxton RB, Frank LR. A model for the coupling between cerebral blood flow and oxygen metabolism during neural stimulation. J Cereb Blood Flow Metab. 1997;17:64–72. - PubMed
-
- Frackowiak RS, Lenzi GL, Jones T, Heather JD. Quantitative measurement of regional cerebral blood flow and oxygen metabolism in man using 15O and positron emission tomography: theory, procedure, and normal values. J Comput Assist Tomogr. 1980;4:727–736. - PubMed
-
- Gjedde A, Poulsen PH, Ostergaard L. On the oxygenation of hemoglobin in the human brain. Adv Exp Med Biol. 1999;471:67–81. - PubMed
MeSH terms
Substances
LinkOut - more resources
Full Text Sources
