

doi: 10.1364/OL.35.000574.
Spectrally encoded confocal scanning laser ophthalmoscopy
Affiliations
- PMID: 20160822
- PMCID: PMC5991605
- DOI: 10.1364/OL.35.000574
Item in Clipboard
Spectrally encoded confocal scanning laser ophthalmoscopy
Opt Lett.
.
Abstract
We present in vivo human fundus imaging using a fiber-based confocal scanning laser ophthalmoscope (SLO). Spectrally encoded confocal scanning laser ophthalmoscopy (SECSLO) utilizes a spectral encoding technique in one dimension, combined with single-axis lateral scanning, to create video-rate reflectivity maps of the fundus. This implementation of the SLO allows for high-contrast high-resolution in vivo human retinal imaging through a single-mode optical fiber. We experimentally quantify the full confocality of SECSLO in both the spectrally encoded and laterally scanned dimensions, and demonstrate 50 Hz frame rate fundus imaging.
Figures
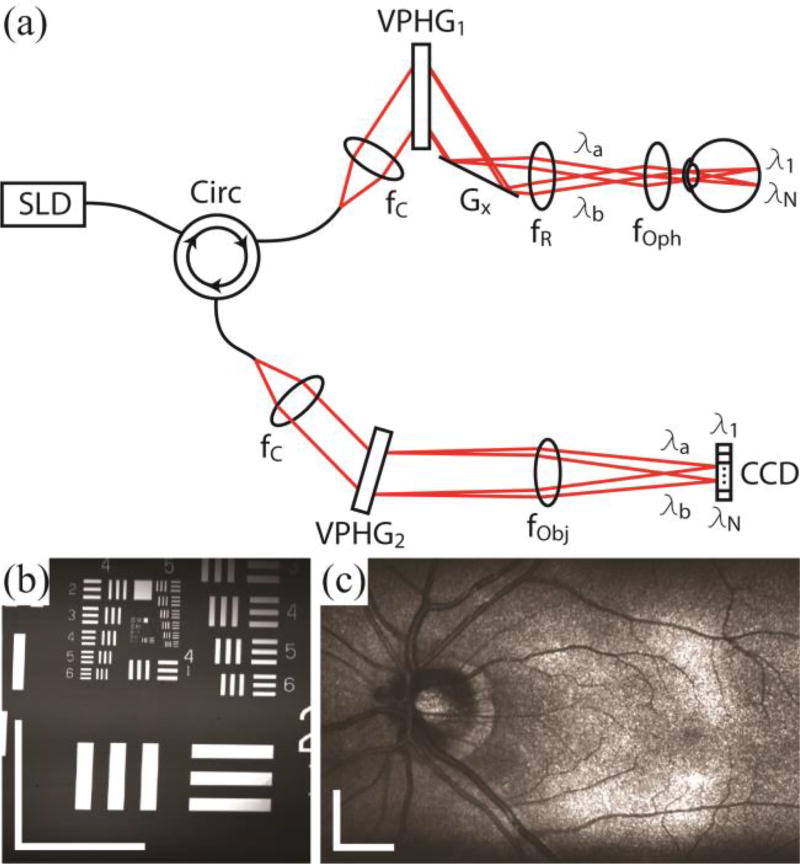
Optical schematic and image quality of the SECSLO. (a) Fiber-based spectrally encoded ophthalmoscope. CCD, linear CCD array; f, focal length of collimating, relay, and focusing elements; G, galvanometer; VPHG, grating. (b) 2.5 × 2.5 mm image of USAF 1951 test chart. Spatial resolution was determined to be 16 µm in both lateral directions. (c) 7 × 5 mm (lateral × spectral) image of an average of 5 registered frames of in vivo human fundus. All images are acquired with 1024 × 1024 pixels at 52 kHz line-rate. Illumination power = 700 µW, scale bar = 5 deg.
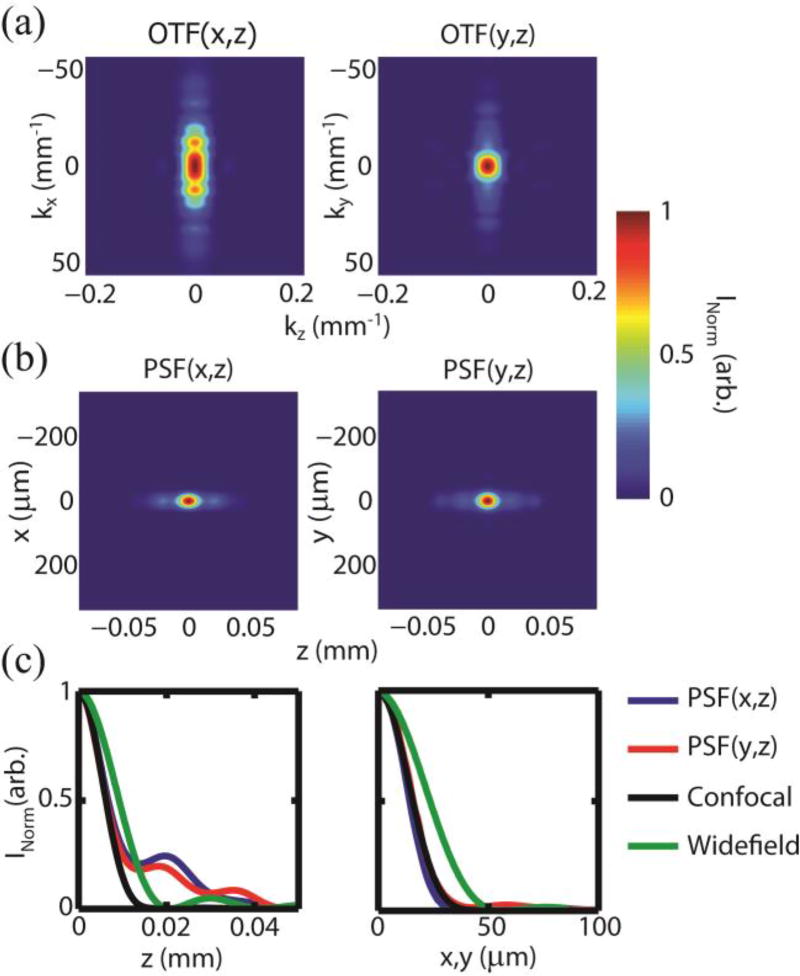
Resolution of SECSLO. (a) Lateral (x) and spectral (y) OTF cross-sections as a function of z. (b) PSF cross-sections calculated from the Fourier transform of the OTF cross-sections. (c) Axial and lateral PSF cross-sections for both lateral and spectral axes compared with theoretical values for confocal and widefield imaging systems.
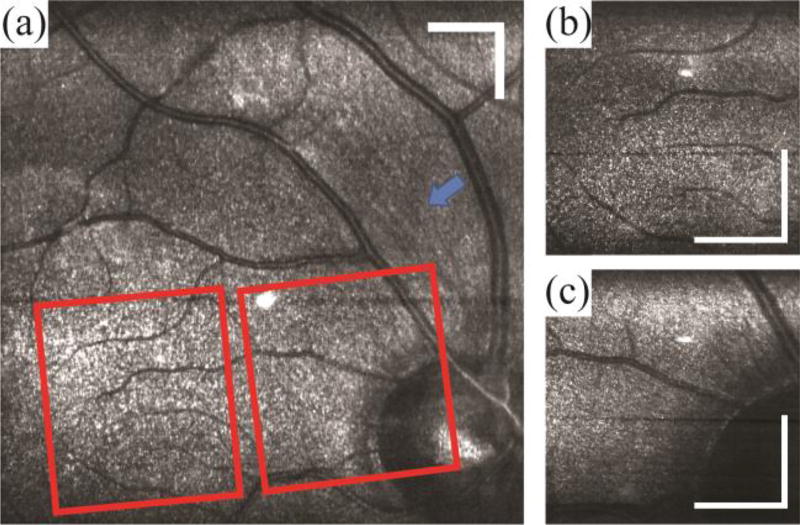
Average of 10 registered images of in vivo human macula. (a) Large FOV image with optically magnified images (red boxes) of (b) fovea and (c) optic nerve superimposed. Images were acquired with 1024 × 1024 pixels at a line-rate of 10 kHz. Illumination power = 700 µW, scale bar = 3 deg.
References
-
- Webb RH, Hughes GW. IEEE transactions on bio-medical engineering. 1981;28 - PubMed
-
- Webb RH, Hughes GW, Delori FC. Applied Optics. 1987;26:1492. - PubMed
-
- Webb RH, Hughes GW, Pomeranzeff O. Applied Optics. 1980;19:2991. - PubMed
-
- Hammer DX, Ferguson RD, Ustun TE, Bigelow CE, Iftimia NV, Webb RH. Journal of biomedical optics. 2006;11 - PubMed
-
- Podoleanu AG, Dobre GM, Cucu RG, Rosen R, Garcia P, Nieto J, Will D, Gentile R, Muldoon T, Walsh J, Yannuzzi LA, Fisher Y, Orlock D, Weitz R, Rogers JA, Dunne S, Boxer A. Journal of biomedical optics. 2004;9 - PubMed
Publication types
MeSH terms
Grants and funding
LinkOut - more resources
Full Text Sources
