

Coupled Flow-Structure-Biochemistry Simulations of Dynamic Systems of Blood Cells Using an Adaptive Surface Tracking Method
- PMID: 20160939
- PMCID: PMC2765665
- DOI: 10.1016/j.jfluidstructs.2009.02.002
Coupled Flow-Structure-Biochemistry Simulations of Dynamic Systems of Blood Cells Using an Adaptive Surface Tracking Method
Abstract
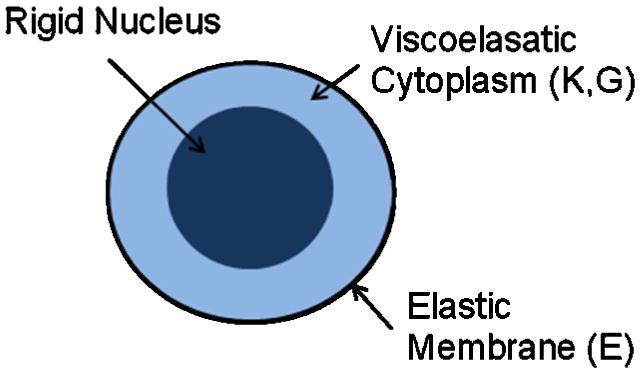
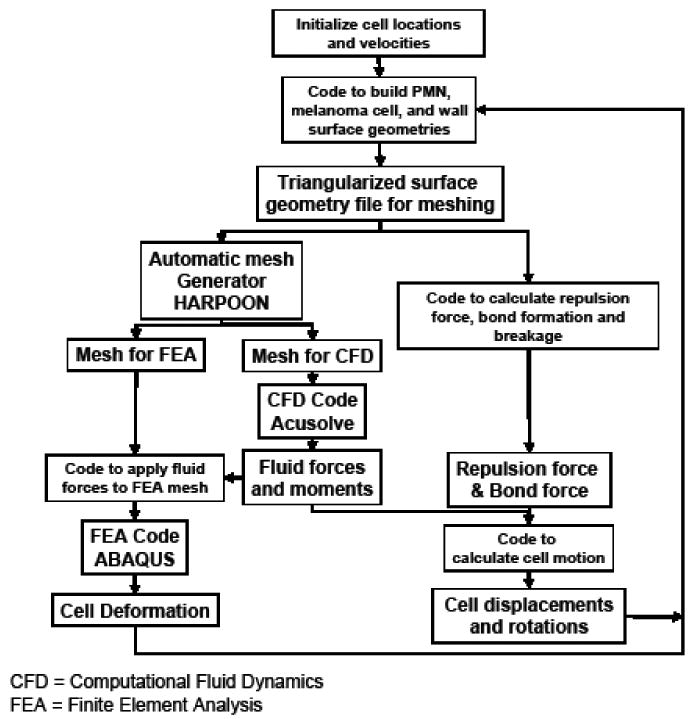
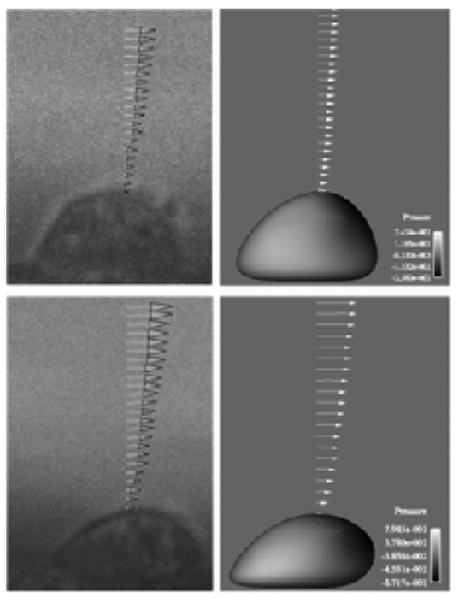
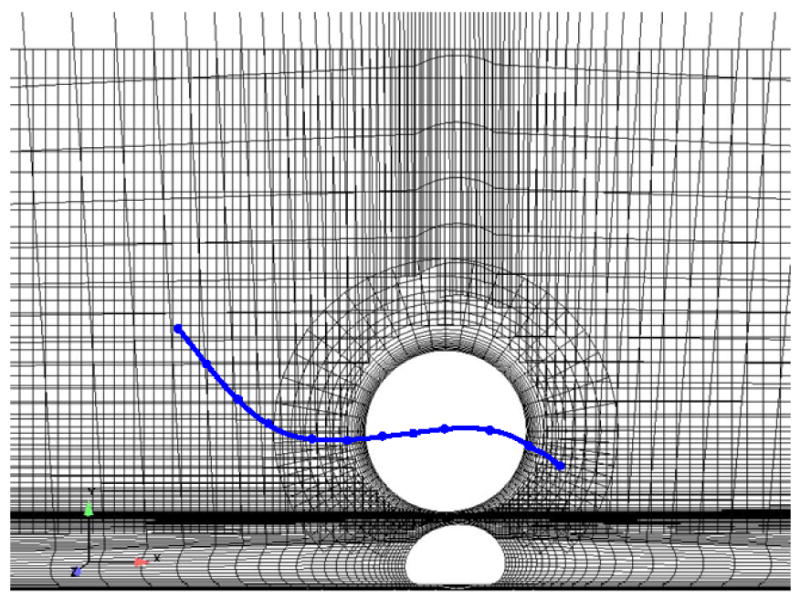
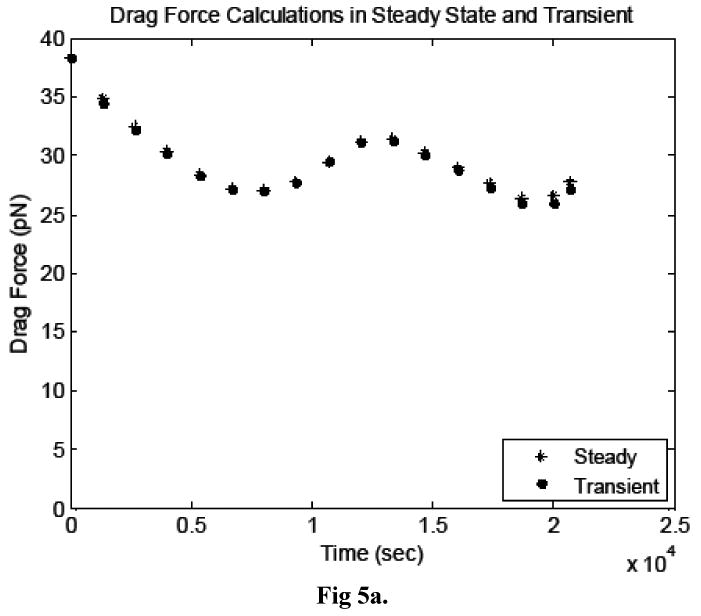
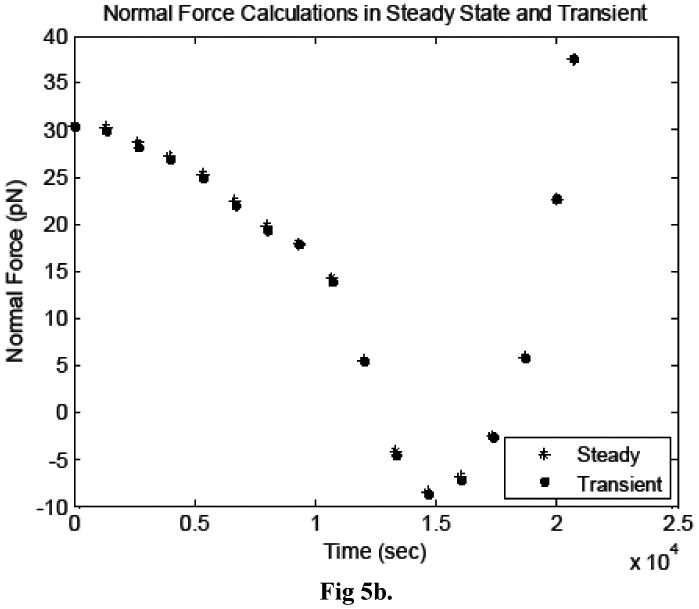
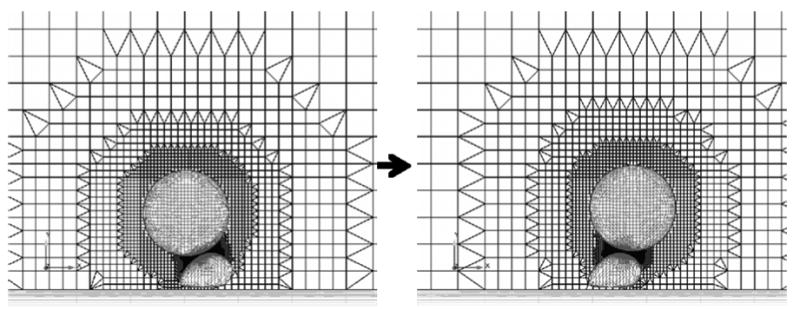
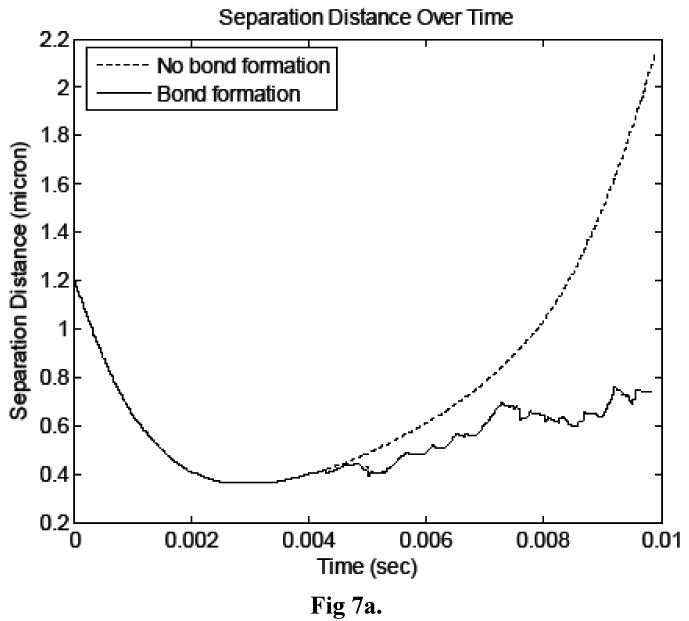
A method for the computation of low Reynolds number dynamic blood cell systems is presented. The specific system of interest here is interaction between cancer cells and white blood cells in an experimental flow system. Fluid dynamics, structural mechanics, six-degree-of freedom motion control and surface biochemistry analysis components are coupled in the context of adaptive octree-based grid generation. Analytical and numerical verification of the quasi-steady assumption for the fluid mechanics is presented. The capabilities of the technique are demonstrated by presenting several three-dimensional cell system simulations, including the collision/interaction between a cancer cell and an endothelium adherent polymorphonuclear leukocyte (PMN) cell in a shear flow.
Figures
Similar articles
-
Effects of steady shear flow on the deformation of leukocyte adhered to vascular endothelial surface.Space Med Med Eng (Beijing). 2004 Feb;17(1):7-11. Space Med Med Eng (Beijing). 2004. PMID: 15005109
-
Role of P-selectin and leukocyte activation in polymorphonuclear cell adhesion to surface adherent activated platelets under physiologic shear conditions (an injury vessel wall model).Blood. 1994 May 1;83(9):2498-507. Blood. 1994. PMID: 7513201
-
Deformation mechanism of leukocyte adhering to vascular surface under steady shear flow.Sci China C Life Sci. 2004 Apr;47(2):165-74. doi: 10.1360/02yc0255. Sci China C Life Sci. 2004. PMID: 15379249
-
Potential and constraints for the application of CFD combined with Lagrangian particle tracking to dry powder inhalers.Eur J Pharm Sci. 2019 Feb 1;128:299-324. doi: 10.1016/j.ejps.2018.12.008. Epub 2018 Dec 14. Eur J Pharm Sci. 2019. PMID: 30553814 Review.
-
Moderate-intensity exercise suppresses platelet activation and polymorphonuclear leukocyte interaction with surface-adherent platelets under shear flow in men.Thromb Haemost. 2004 Mar;91(3):587-94. doi: 10.1160/TH03-10-0644. Thromb Haemost. 2004. PMID: 14983236
Cited by
-
Multi-scale biological and physical modelling of the tumour micro-environment.Drug Discov Today Dis Models. 2015 Summer;16:7-15. doi: 10.1016/j.ddmod.2015.03.001. Epub 2015 Jul 20. Drug Discov Today Dis Models. 2015. PMID: 31303886 Free PMC article.
-
Effects of the Tumor-Leukocyte Microenvironment on Melanoma-Neutrophil Adhesion to the Endothelium in a Shear Flow.Cell Mol Bioeng. 2008 Sep 1;1(2-3):189-200. doi: 10.1007/s12195-008-0016-8. Cell Mol Bioeng. 2008. PMID: 19865613 Free PMC article.
-
Study of local hydrodynamic environment in cell-substrate adhesion using side-view μPIV technology.PLoS One. 2012;7(2):e30721. doi: 10.1371/journal.pone.0030721. Epub 2012 Feb 17. PLoS One. 2012. PMID: 22363477 Free PMC article.
-
Localized Modeling of Biochemical and Flow Interactions during Cancer Cell Adhesion.PLoS One. 2015 Sep 14;10(9):e0136926. doi: 10.1371/journal.pone.0136926. eCollection 2015. PLoS One. 2015. PMID: 26366568 Free PMC article.
-
Application of Population Dynamics to Study Heterotypic Cell Aggregations in the Near-Wall Region of a Shear Flow.Cell Mol Bioeng. 2010 Mar 1;3(1):3-19. doi: 10.1007/s12195-010-0114-2. Cell Mol Bioeng. 2010. PMID: 20428326 Free PMC article.
References
-
- ACUSIM Software Inc. http://www.acusim.com/html/acusolve.html.
-
- Bell GI. Models for the specific adhesion adhesion of cells to cells. Science. 1978;200:618–627. - PubMed
-
- Belk DM, Maple RC. Automated assembly of structured grids for moving body problems. AIAA Paper 1995-1680.Proceedings of the 12th AIAA Computational Fluid Dynamics Conference; 1995.
-
- Brennen CE. Cavitation and Bubble Dynamics. Oxford University Press; New York, NY: 1995.
-
- Bongrand P, Bell GI. Cell-Cell Adhesion: Parameters and Possible Mechanisms. Marcel Dekker Inc.; New York, NY: 1984.
Grants and funding
LinkOut - more resources
Full Text Sources