

doi: 10.1016/j.pnmrs.2008.06.002.
Characterization of protein secondary structure from NMR chemical shifts
Affiliations
- PMID: 20160946
- PMCID: PMC2766081
- DOI: 10.1016/j.pnmrs.2008.06.002
Item in Clipboard
Characterization of protein secondary structure from NMR chemical shifts
Prog Nucl Magn Reson Spectrosc.
.
No abstract available
Figures
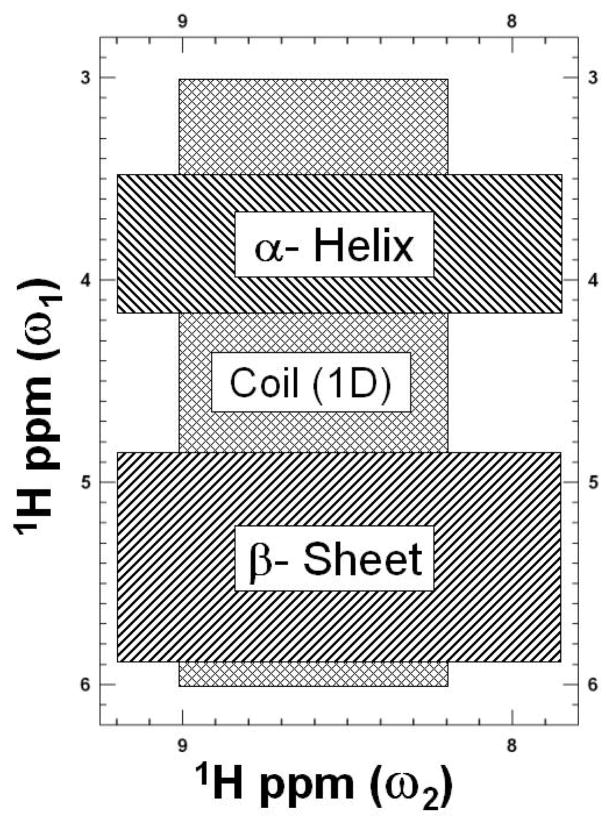
Schematic description of the peak counting method developed to determine protein secondary structure content. A typical double quantum filter COSY (DQFC) spectrum is shaded to highlight the regions of important structural information. The two hatched blocks marked by β-sheet and α-helix, correspond to the areas used to estimate the β-strand and α-helix, respectively. The hatched region marked Coil (1D) used to estimate the random coil content. Coil information is also obtained from one-dimensional NMR spectra. Some peaks appear in overlapping regions and hence are counted twice when making secondary structure estimates.
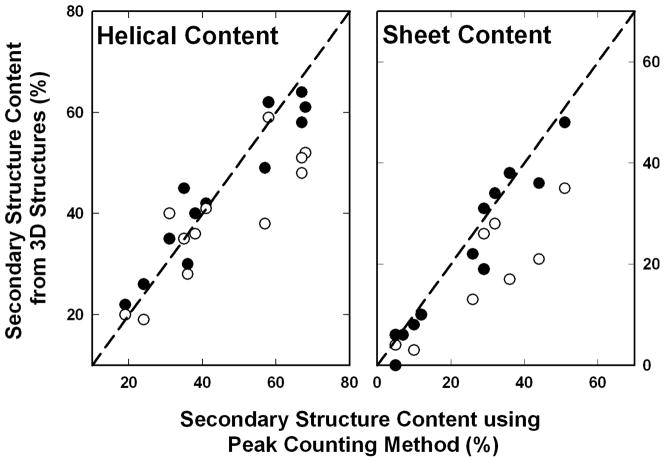
Comparison of the empirical correlations derived to estimate secondary structure content from proteins by peak counting method. Filled and open circles show the secondary structure content estimated from the three-dimensional structures originally and using recent structural biology tools, respectively. The dashed lines show the ideal linear correlation.
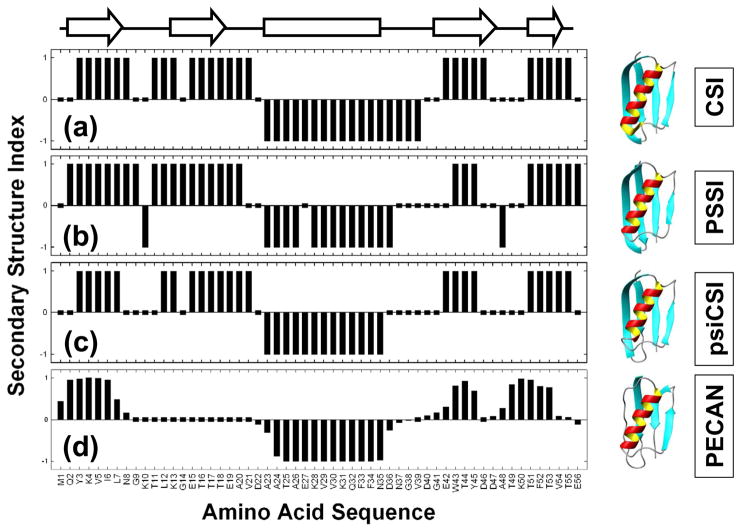
Plot of the secondary structure indices calculated for Protein G using four different methods, (a) CSI, (b) PSSI, (c) psiCSI and (d) PECAN. Secondary structure indices, +1, 0 and −1 correspond to α-helix, coil and β-strand, respectively. The chemical shift information is obtained from BMRB (bmr5664.str) and the programs CSI, PSSI, psiCSI and PECAN are used with their default setup. The arrows and the bar at the top of the figure are the secondary structure determined from the ensemble averaged NMR structures (RCSB file 1GB1) and the respective secondary structures are also superimposed on the 3D structure, using the molecular rendering program MOLMOL [66].
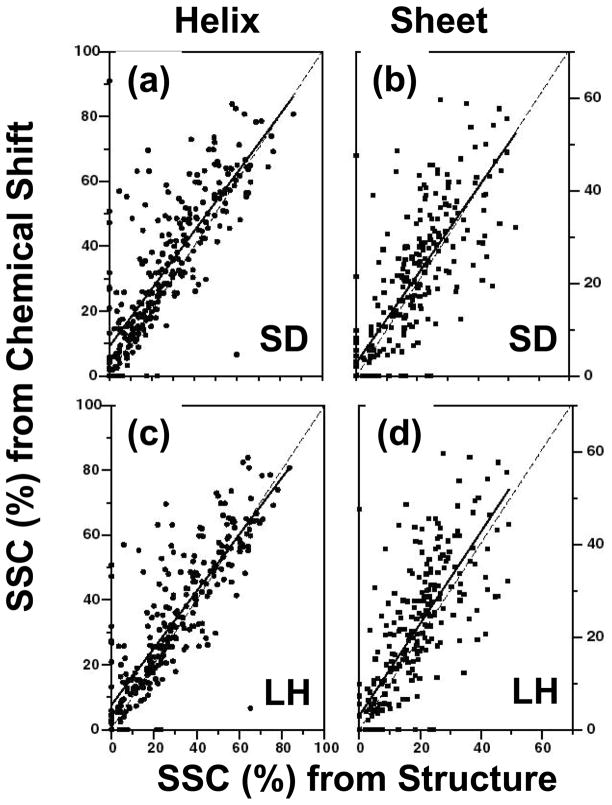
Plots of secondary structure content (SSC) in percentage determined from chemical shifts and three-dimensional coordinates. Panels (a) helical and (b) sheet content for the original SD [74], [90] random coil reference values correspond to (Table 3), while (c) and (d) show the corresponding correlations for using the random coil chemical shifts of LH [75]. The dashed line corresponds to an ideal correlation, while the solid line represents the linear regression analysis results (Table 5).
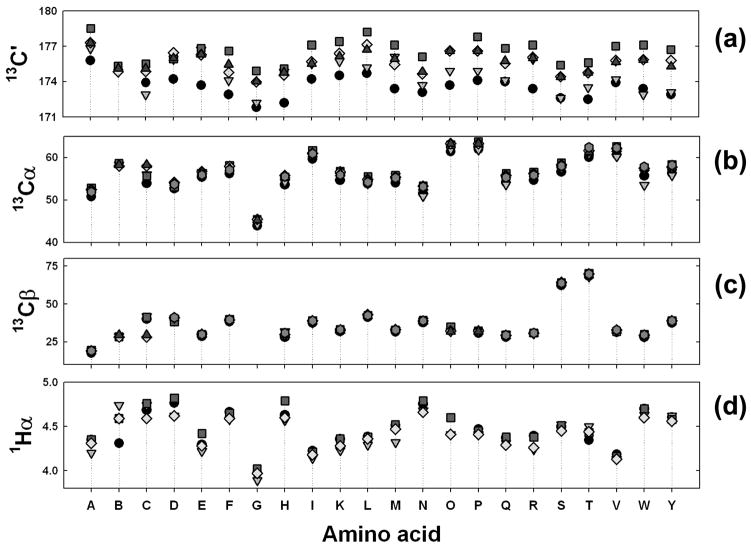
Plots of the variation in the reference random coil values as a function of amino acid type. Panels (a), (b), (c) and (d) correspond to random coil values of 13C′ (carbonyl carbon), 13Cα, 13Cβ and 1Hα, respectively. The six different reference value sets are represented by symbols: black circles (KW) [21], [76], grey triangles (WS) [77], [199], black squares (SD) [74], [90], grey diamonds (LH) [75], black triangles (WJ) and grey circles (WM) [59], [80]. Plots (b) and (c) have all the six sets and plots (a) and (b) have only 5 and 4 sets, respectively (Table 5). Amino acids along the X-axis are given in single letter codes, with ‘B’ and ‘O’ representing oxidized cystine and cis-proline, respectively.
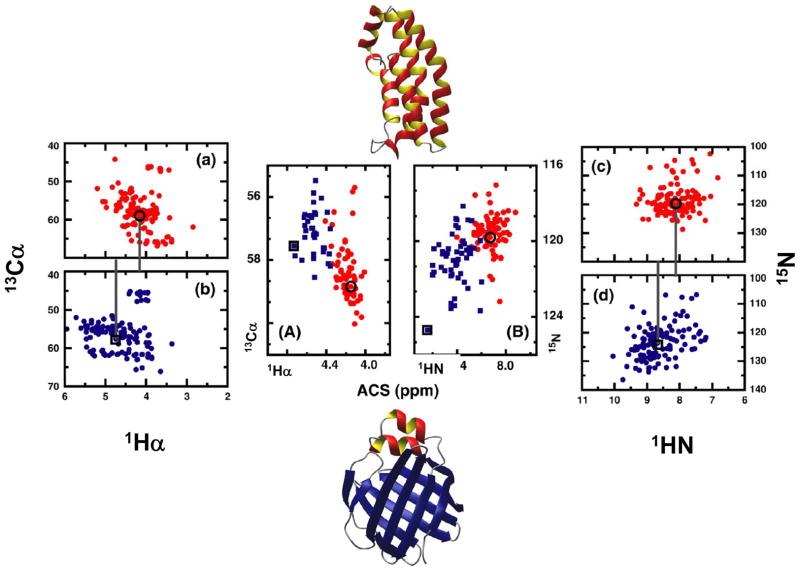
Representative examples to show that averaged chemical shift (ACS) is a structural parameter directly obtainable from NMR spectra. (a) and (c): simulated 13C and 15N-HSQC spectra of an α-helical protein (Histidine kinase, PDB code 1A0B, BMRB number 4857), respectively. (b) and (d): simulated 13C and 15N-HSQC spectra of a β-sheet protein (Liver fatty acid binding protein, PDB code 1LFO, BMRB number 4098). The ACS calculated from each spectrum is noted by a black circle (helical protein) and square (sheet protein). (A) and (B): representative examples of the ACS values calculated from 13Cα-1Hα and 15N-1HN correlations, respectively, for a set of proteins for which chemical shift information is obtained from BioMagResBank. The red circles and blue squares correspond to proteins that are classified as mainly-α and mainly–β, respectively, under the CATH classification scheme. ACS values from (a) and (b), and (c) and (d), are reproduced in (A) and (B), respectively. Reproduced with permission from Ref. [149].
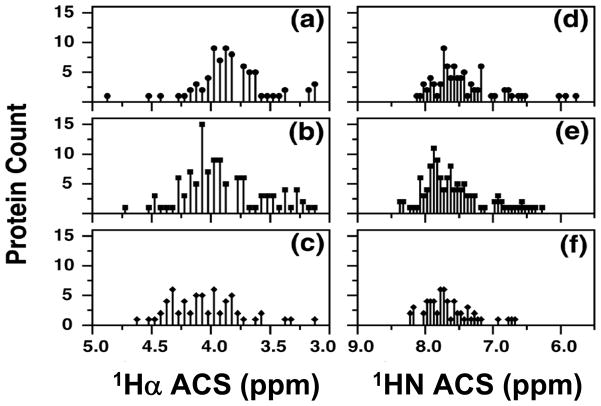
ACS values vs. number of proteins in the three major structural classes defined according to the SCOP method. (a), (b), and (c) display the 1Hα ACS values for proteins that are mainly-α, mainly-β, and a mixture of α and β (αβ) (both α/β and α+β), respectively. (d), (e), and (f) display the corresponding 1HN values for mainly-α, mainly-β, and αβ (both α/β and α+β), respectively. Reproduced with permission from Ref. [149].
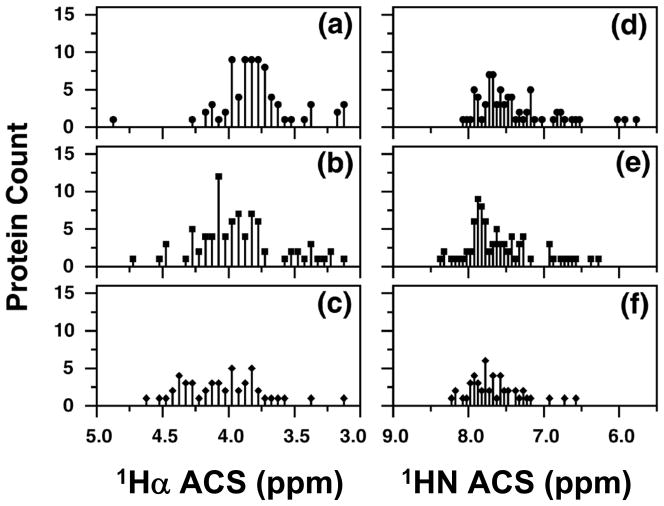
ACS values vs. number of proteins in the three major structural classes defined according to the CATH method. (a), (b), and (c) display the 1Hα ACS values for proteins that are α, β, and αβ (both α/β and α+β), respectively. (d), (e), and (f) display the corresponding 1HN values for α, β, and αβ (both α/β and α+β), respectively. Reproduced with permission from Ref. [149].
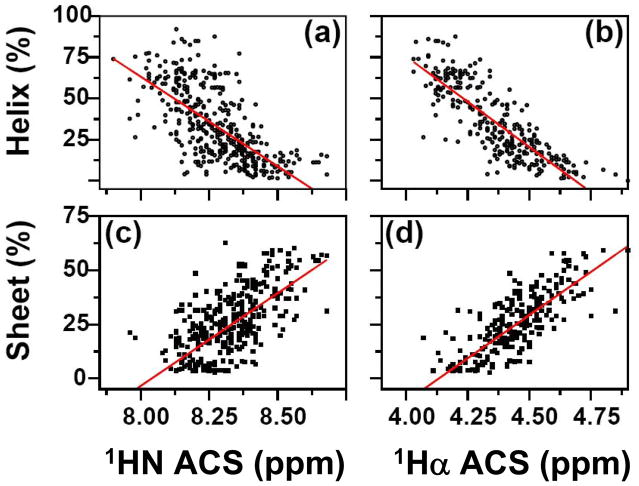
Plots of the averaged chemical shift (ACS) values from experimental data versus the secondary structure content (SSC) estimated from three-dimensional structures. (a) and (c) show percent helix (circles) and sheet (squares) versus ACS for HN, whereas (b) and (d) show the corresponding plots for Hα. The continuous lines show the a linear regression analysis of the data. Reproduced with permission from Ref. [111].
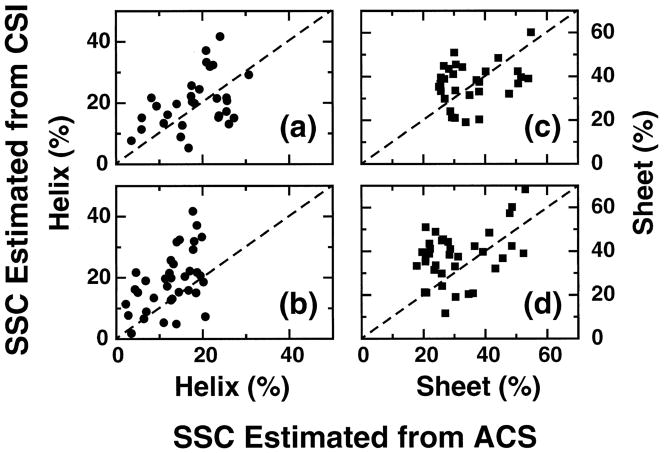
Comparison of helical and sheet content percent calculated using 1Hα or 1HN ACS values to that obtained using a consensus chemical shift index based method for a set of proteins for which no three dimensional structures are available. (a) and (b) correspond to the helical content using the 1Hα and 1HN ACS values, respectively, while (c) and (d) are the corresponding sheet content using the same ACS values. The dashed lines correspond to a perfect correlation between these two methods.
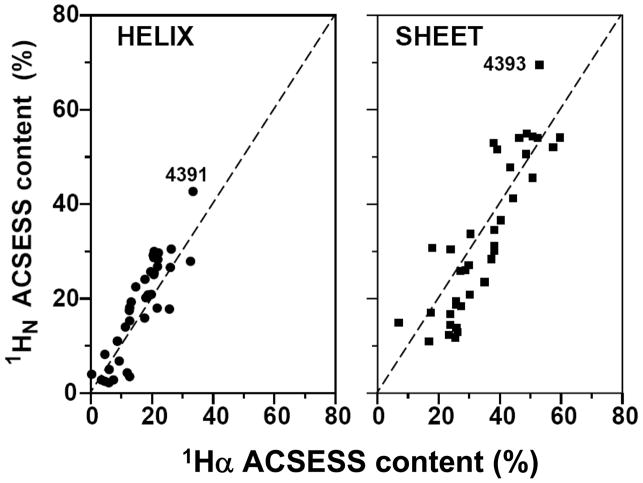
Comparison of helical (LEFT) and sheet (RIGHT) content calculated using ACSESS with either 1Hα or 1HN ACS values for a set of proteins for which no three dimensional structure are available. The numbers for two proteins are their identification codes in the BMRB database (see Table 10).
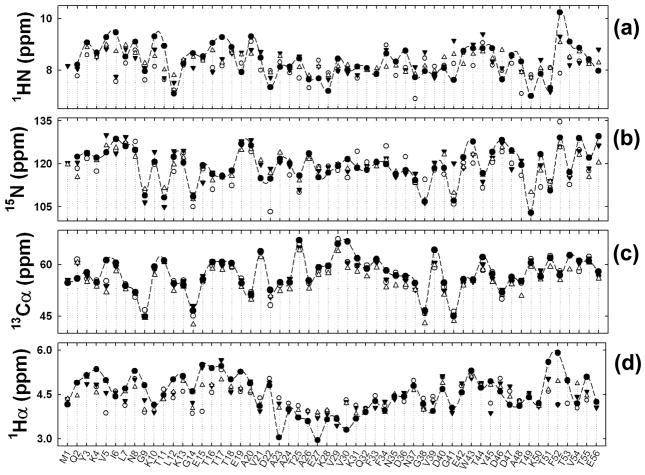
Comparison of semi-empirical methods to calculate the chemical shifts of an example proteins, protein G. Panels (a), (b), (c) and (d) show the plots of chemical shifts values of the nuclei, 1HN, 15N, 13Cα and 1Hα, respectively. Experimental chemical shifts of protein G (bmr5875) in filled circles to that chemical shifts calculated using SHIFTX (open circles), SHIFTS (filled triangles) and PROSHIFT (open triangles). A dashed line is connected through a experimental points to show a visual trend.
References
-
- Proctor WG, Yu FC. The dependence of a nuclear magnetic resonance frequency upon chemical compound. Phy Rev. 1950;77:717.
-
- Arnold JT, DSS, Packard ME. Chemical effects on nuclear-induction signals from organic compounds. J Chem Phys. 1951;19:507.
-
- Asakura T, Iwadate M, Demura M, Williamson MP. Structural analysis of silk with C-13 NMR chemical shift contour plots. Int J Biol Macromol. 1999;24:167–171. - PubMed
-
- Asakura T, Taoka K, Demura M, Williamson MP. The Relationship Between Amide Proton Chemical Shifts and Secondary Structure in Proteins. J Biomol NMR. 1995;6:227–236. - PubMed
-
- Cornilescu G, Delaglio F, Bax A. Protein backbone angle restraints from searching a database for chemical shift and sequence homology. J Biomol NMR. 1999;13:289–302. - PubMed
Grants and funding
LinkOut - more resources
Full Text Sources
