. 2009 Jul 24;19(14):2244-2251.
doi: 10.1002/adfm.200801844.

PEI-PEG-Chitosan Copolymer Coated Iron Oxide Nanoparticles for Safe Gene Delivery: synthesis, complexation, and transfection

Affiliations

PEI-PEG-Chitosan Copolymer Coated Iron Oxide Nanoparticles for Safe Gene Delivery: synthesis, complexation, and transfection

Forrest M Kievit et al. Adv Funct Mater. .

Abstract

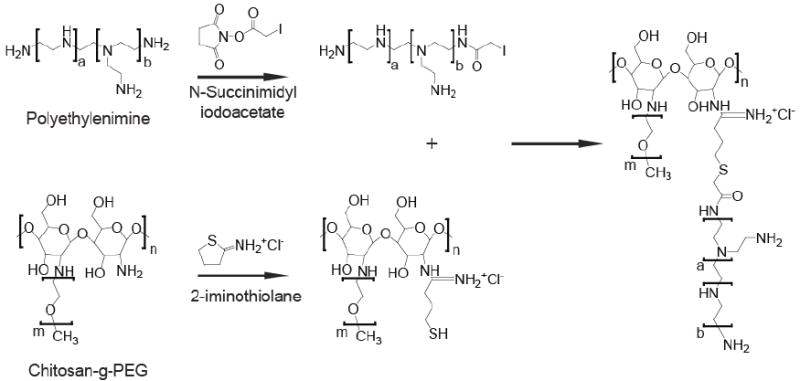
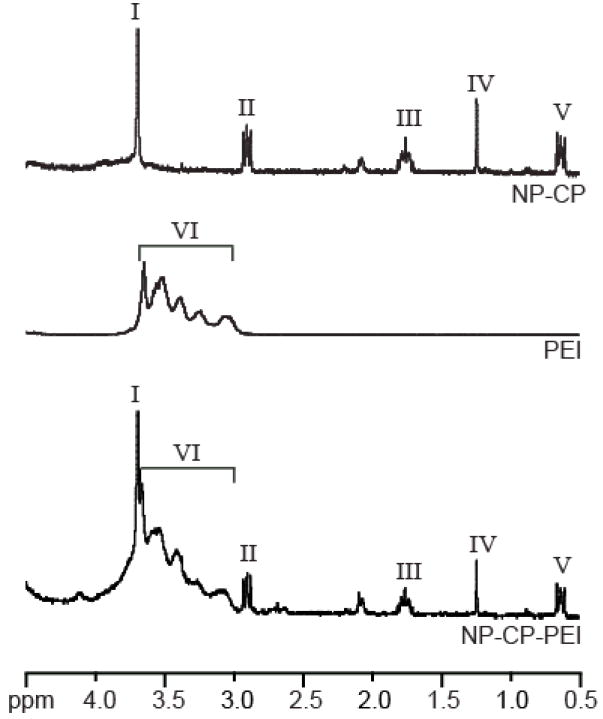
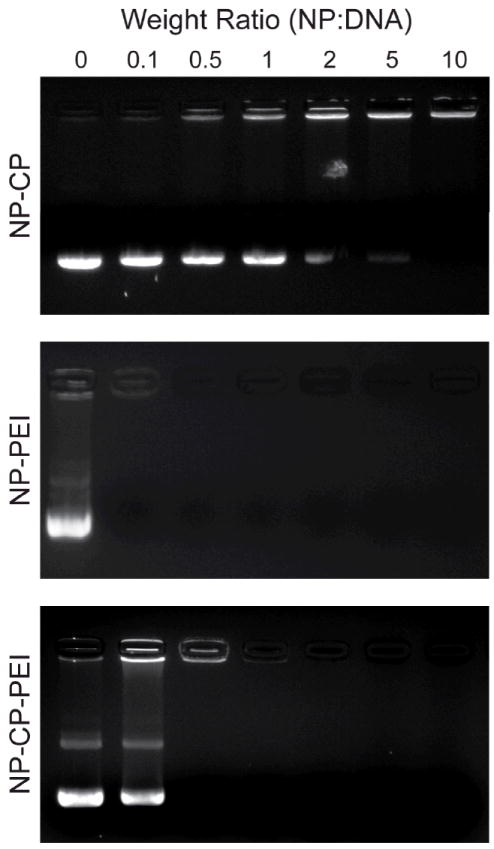
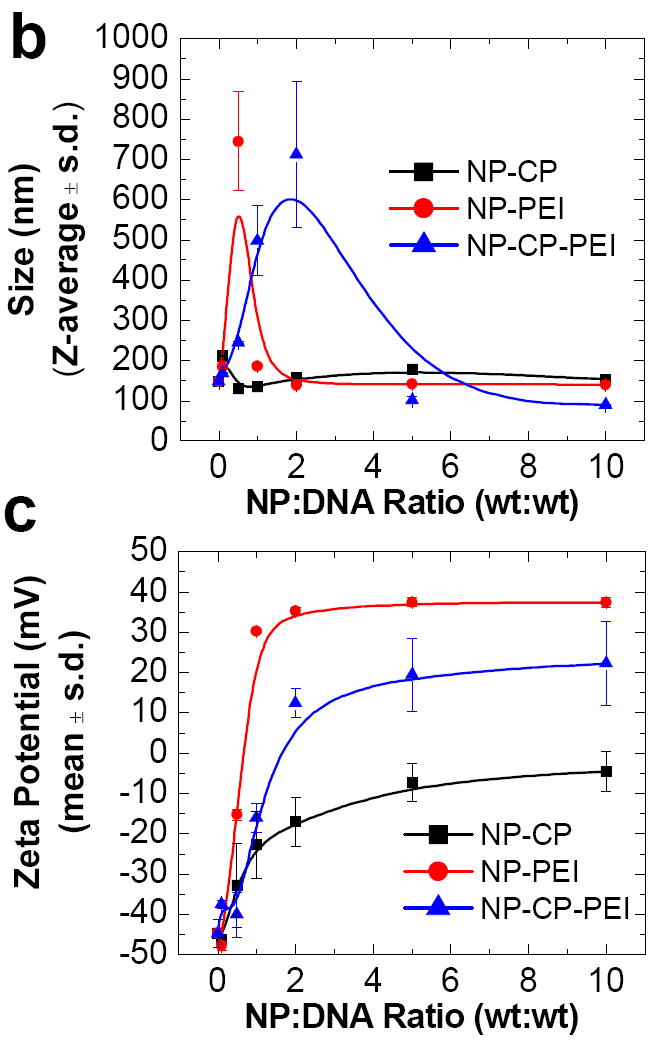
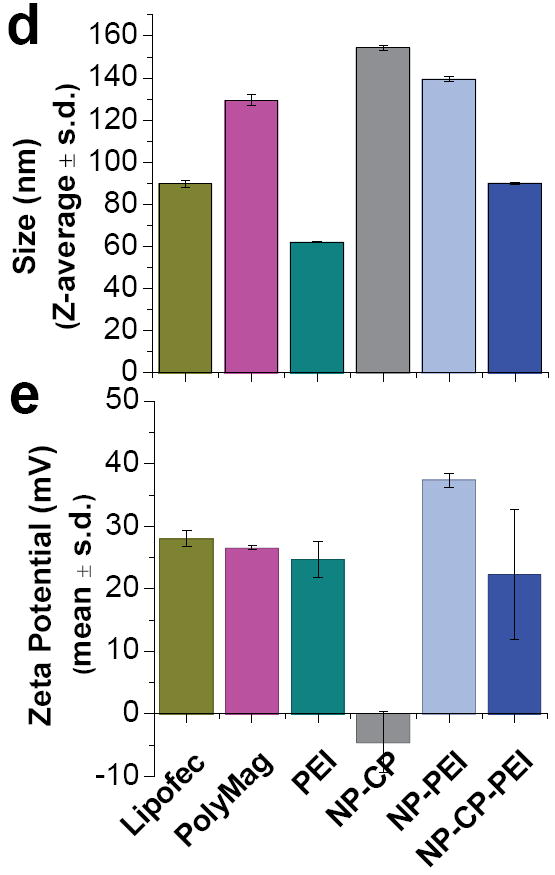
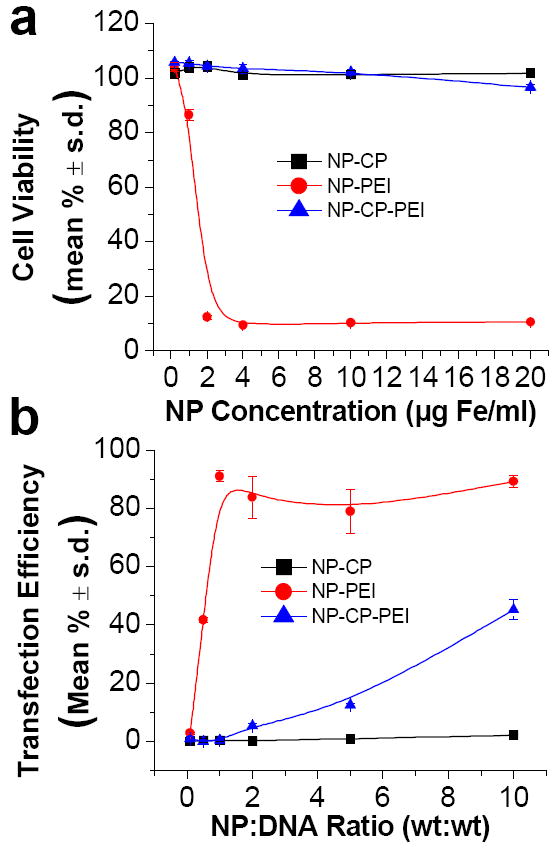
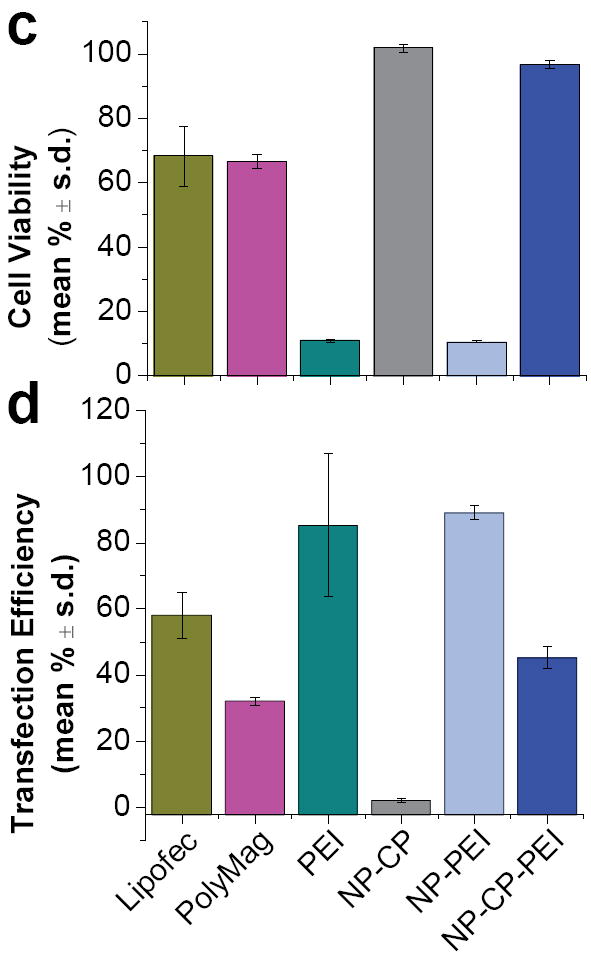
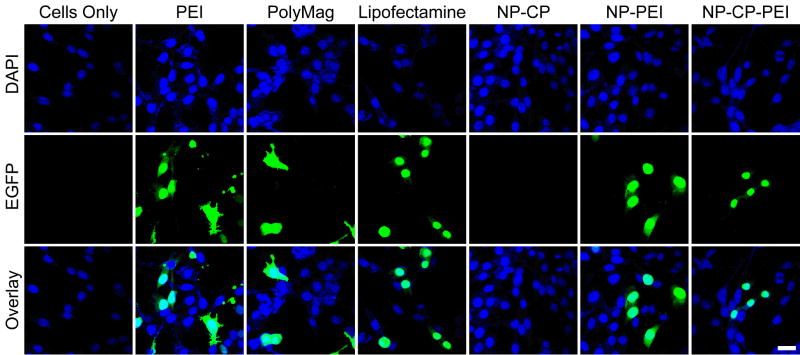
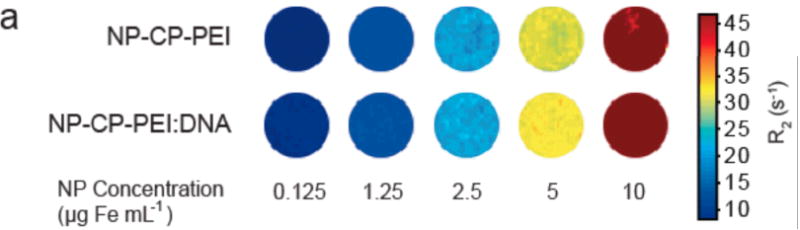
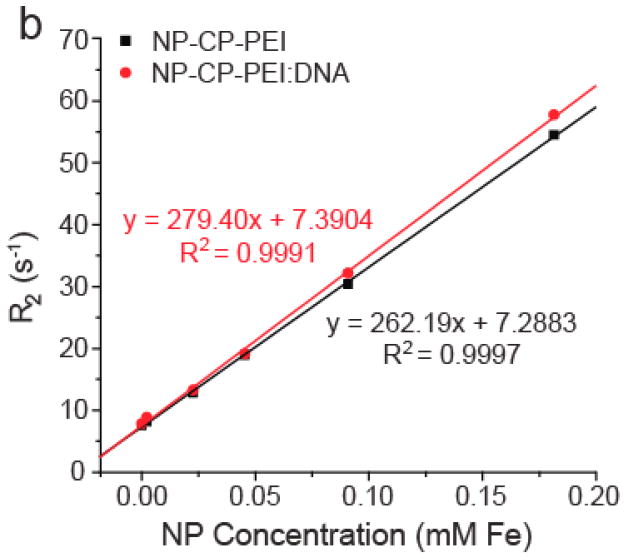
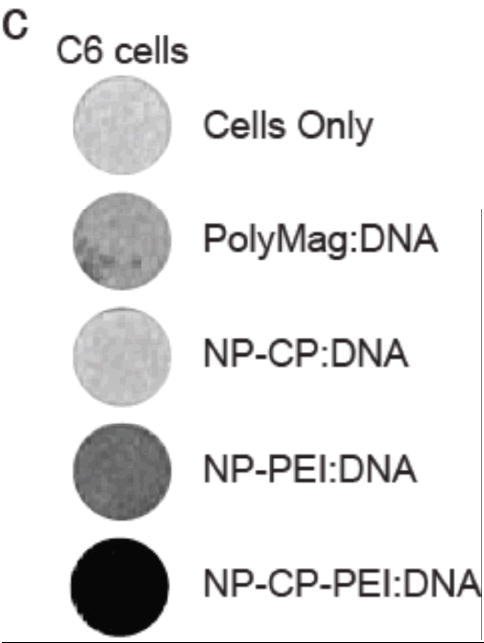
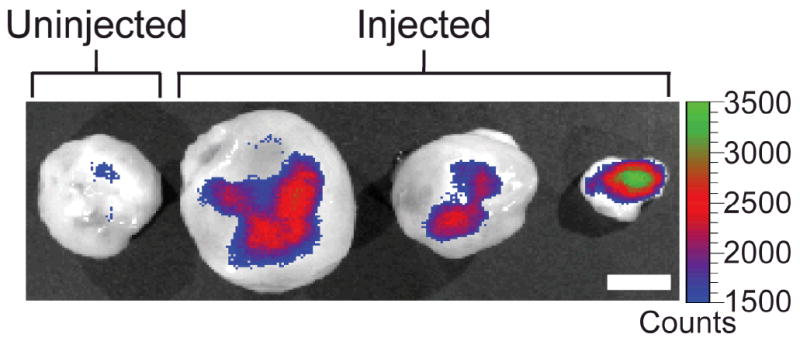
Gene therapy offers the potential of mediating disease through modification of specific cellular functions of target cells. However, effective transport of nucleic acids to target cells with minimal side effects remains a challenge despite the use of unique viral and non-viral delivery approaches. Here we present a non-viral nanoparticle gene carrier that demonstrates effective gene delivery and transfection both in vitro and in vivo. The nanoparticle system (NP-CP-PEI) is made of a superparamagnetic iron oxide nanoparticle (NP), which enables magnetic resonance imaging, coated with a novel copolymer (CP-PEI) comprised of short chain polyethylenimine (PEI) and poly(ethylene glycol) (PEG) grafted to the natural polysaccharide, chitosan (CP), which allows efficient loading and protection of the nucleic acids. The function of each component material in this nanoparticle system is illustrated by comparative studies of three nanoparticle systems of different surface chemistries, through material property characterization, DNA loading and transfection analyses, and toxicity assessment. Significantly, NP-CP-PEI demonstrates an innocuous toxic profile and a high level of expression of the delivered plasmid DNA in a C6 xenograft mouse model, making it a potential candidate for safe in vivo delivery of DNA for gene therapy.


Figures

Figure 1
Figure 1
Synthesis of NP-CP-PEI. As synthesized NP-CP was modified with Traut’s Reagent (2-iminothiolane) and then reacted with SIA modified PEI to produce the NP-CP-PEI.
Figure 2
Figure 2
Proton NMR analysis of NP-CP, PEI, and NP-CP-PEI showing the incorporation of PEI onto NP-CP. The characteristic peak of the –O–CH2–CH2– group of PEG (peak I) on NP-CP and –NH2–CH2–CH2– group of PEI (peak II) are all present in the NP-CP-PEI spectrum. All samples were analyzed in D2O.
Figure 3
Figure 3
Ability of NP-CP, NP-PEI, and NP-CP-PEI to bind plasmid DNA and their physiochemical properties. a) Gel retardation assay of NPs complexing plasmid DNA at different weight ratios of nanoparticle to DNA. b) and c) Hydrodynamic sizes and zeta potentials, respectively, of NP-CP, NP-PEI, and NP-CP-PEI complexed with plasmid DNA at different weight ratios. d) and e) Comparison of hydrodynamic sizes and zeta potentials, respectively, of NP:DNA prepared in this study and control transfection agents complexed with DNAs.
Figure 3
Figure 3
Ability of NP-CP, NP-PEI, and NP-CP-PEI to bind plasmid DNA and their physiochemical properties. a) Gel retardation assay of NPs complexing plasmid DNA at different weight ratios of nanoparticle to DNA. b) and c) Hydrodynamic sizes and zeta potentials, respectively, of NP-CP, NP-PEI, and NP-CP-PEI complexed with plasmid DNA at different weight ratios. d) and e) Comparison of hydrodynamic sizes and zeta potentials, respectively, of NP:DNA prepared in this study and control transfection agents complexed with DNAs.
Figure 4
Figure 4
Toxicity and transfection efficiency of NP:DNA complexes. a) Viability of cells treated with different concentrations of NP-CP:DNA, NP-PEI:DNA, and NP-CP-PEI:DNA. b) Transfection efficiencies of cells treated with either NP-CP:DNA, NP-PEI:DNA, or NP-CP-PEI:DNA of different NP:DNA ratios (all with DNA concentration of 2 μg ml−1). c) and d) Viability and transfection efficiency, respectively, of cells treated with NP:DNA complexes prepared in this study in comparison with control transfection agents (NP:DNA ratios of NP-CP:DNA, NP-PEI:DNA, and NP-CP-PEI:DNA are all 10:1).
Figure 4
Figure 4
Toxicity and transfection efficiency of NP:DNA complexes. a) Viability of cells treated with different concentrations of NP-CP:DNA, NP-PEI:DNA, and NP-CP-PEI:DNA. b) Transfection efficiencies of cells treated with either NP-CP:DNA, NP-PEI:DNA, or NP-CP-PEI:DNA of different NP:DNA ratios (all with DNA concentration of 2 μg ml−1). c) and d) Viability and transfection efficiency, respectively, of cells treated with NP:DNA complexes prepared in this study in comparison with control transfection agents (NP:DNA ratios of NP-CP:DNA, NP-PEI:DNA, and NP-CP-PEI:DNA are all 10:1).
Figure 5
Figure 5
Confocal fluorescence images of C6 cells treated with different transfection agents complexed with DNA. The DAPI nuclear stain is shown in blue and EGFP fluorescence is shown in green. The scale bar corresponds to 20 μm.
Figure 6
Figure 6
Magnetic properties of NP-CP-PEI and NP-CP-PEI:DNA, and MRI contrast enhancement by cellular uptake of NP:DNA complexes. a) Phantom images of NP-CP-PEI and NP-CP-PEI:DNA samples as a function of nanoparticle concentration. b) Relaxation (R2) plot of NP-CP-PEI and NP-CP-PEI:DNA samples as a function of nanoparticle concentration showing NP-CP-PEI retained the magnetism (magnetic relaxivity, i.e., the slop of the curve) after complexing with DNA (262 mM−1 s−1 for NP-CP-PEI versus 279 mM−1 s−1 for NP-CP-PEI:DNA). c) T2 weighted images (TR = s, TE = 60 ms) of C6 cells incubated with NP:DNA complexes prepared in this study and commercial PolyMag:DNA showing the degree of uptake of these NP:DNA complexes by C6 cells and enhanced contrast provided by cellular uptake.
Figure 6
Figure 6
Magnetic properties of NP-CP-PEI and NP-CP-PEI:DNA, and MRI contrast enhancement by cellular uptake of NP:DNA complexes. a) Phantom images of NP-CP-PEI and NP-CP-PEI:DNA samples as a function of nanoparticle concentration. b) Relaxation (R2) plot of NP-CP-PEI and NP-CP-PEI:DNA samples as a function of nanoparticle concentration showing NP-CP-PEI retained the magnetism (magnetic relaxivity, i.e., the slop of the curve) after complexing with DNA (262 mM−1 s−1 for NP-CP-PEI versus 279 mM−1 s−1 for NP-CP-PEI:DNA). c) T2 weighted images (TR = s, TE = 60 ms) of C6 cells incubated with NP:DNA complexes prepared in this study and commercial PolyMag:DNA showing the degree of uptake of these NP:DNA complexes by C6 cells and enhanced contrast provided by cellular uptake.
Figure 7
Figure 7
Xenogen IVIS fluorescence images of flank xenograft C6 tumors of different sizes excised from three mice injected with NP-CP-PEI:DNA and a mouse receiving no injection. The scale bar corresponds to 5 mm.

References

    1. Alexander BL, Ali RR, Alton EW, Bainbridge JW, Braun S, Cheng SH, Flotte TR, Gaspar HB, Grez M, Griesenbach U, Kaplitt MG, Ott MG, Seger R, Simons M, Thrasher AJ, Thrasher AZ, Yla-Herttuala S. Gene Ther. 2007;14:1439. - PubMed
    1. Aiuti A, Bachoud-Levi AC, Blesch A, Brenner MK, Cattaneo F, Chiocca EA, Gao G, High KA, Leen AM, Lemoine NR, McNeish IA, Meneguzzi G, Peschanski M, Roncarolo MG, Strayer DS, Tuszynski MH, Waxman DJ, Wilson JM. Gene Ther. 2007;14:1555. - PubMed
    1. Edelstein ML, Abedi MR, Wixon J. J Gene Med. 2007;9:833. - PubMed
    1. Pack DW, Hoffman AS, Pun S, Stayton PS. Nat Rev Drug Discov. 2005;4:581. - PubMed
    1. McCormack MP, Rabbitts TH. N Engl J Med. 2004;350:913. - PubMed

LinkOut - more resources