

Approaches to biomarkers in human colorectal cancer: looking back, to go forward
- PMID: 20161020
- PMCID: PMC2749258
- DOI: 10.2217/BMM.09.33
Approaches to biomarkers in human colorectal cancer: looking back, to go forward
Abstract
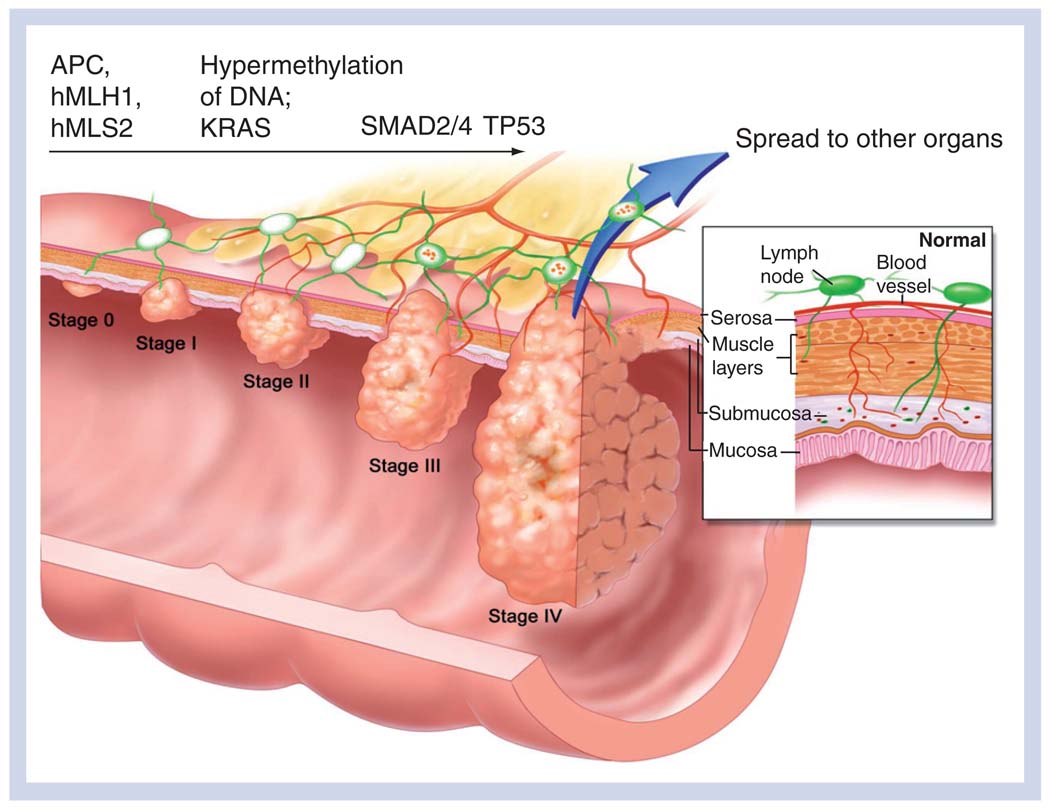
Like all human cancers, colorectal cancer is a complicated disease. While a mature body of research involving colorectal cancer has implicated the putative sequence of genetic alterations that trigger the disease and sustain its progression, there is a surprising paucity of well-validated, clinically useful diagnostic markers of this disease. For prognosis or guiding therapy, single gene-based markers of colorectal cancer often have limited specificity and sensitivity. Genome-wide analyses (microarrays) have been used to propose candidate patterns of gene expression that are prognostic of outcome or predict the tumor's response to a therapy regimen; however, these patterns frequently do not overlap, and this has raised questions concerning their use as biomarkers. The limitation of gene-expression approaches to marker discovery occurs because the change in mRNA expression across tumors is highly variable and, alone, accounts for a limited variability of the phenotype, such as with cancer. More robust and accurate markers of cancer will result from integrating all the information we have about the cell: genomics, proteomics and interactomics. This article will discuss traditional markers in colorectal cancer, both genomic and proteomic, including their respective approaches and limitations, then conclude with examples of systems biology-based approaches for candidate marker discovery, and discuss how this approach is reshaping our view of a biomarker.
Figures
References
Bibliography
-
- Jemal A, Siegel R, Ward E, et al. Cancer statistics. CA Cancer J. Clin. 2008;58:71–96. - PubMed
-
- Powell SM, Petersen GM, Krush AJ, et al. Molecular diagnosis of familial adenomatous polyposis. N. Engl. J. Med. 1993;329:1982–1987. - PubMed
-
- Markowitz SD, Dawson DM, Willis J, Willson JK. Focus on colon cancer. Cancer Cell. 2002;3:233–236. - PubMed
-
- Kinzler KW, Vogelstein B. Lessons from hereditary colon cancer. Cell. 1996;87:159–170. - PubMed
-
- Green RC, Parfrey PS, Woods MO, Younghusband HB. Prediction of Lynch syndrome in consecutive patients with colorectal cancer. J. Natl Cancer Inst. 2009;101:331–340. - PubMed
Websites
-
- National Library of Medicine (USA), Specialized Information Services Division. Bethesda (MD): Lynch syndrome; 2003. [reviewed 2008]. http://chem.sis.nlm.nih.gov/chemidplus/chemidlite.jsp.
-
- American Cancer Society. 2008. www.cancer.org/docroot/cri/content/cri_2_4_1x_what_are_the_key_statistic....
-
- Human Proteome Initiative. 2008. http://ca.expasy.org/sprot/hpi.
-
- National Cancer Institute VisualsOnline. http://visualsonline.cancer.gov/details.cfm?imageid=7181.
Grants and funding
LinkOut - more resources
Full Text Sources