

doi: 10.1016/j.eeh.2009.05.001.
Survival in 19th Century Cities: The Larger the City, the Smaller Your Chances
Affiliations
- PMID: 20161075
- PMCID: PMC2743429
- DOI: 10.1016/j.eeh.2009.05.001
Item in Clipboard
Survival in 19th Century Cities: The Larger the City, the Smaller Your Chances
Explor Econ Hist.
.
Abstract
Using Union Army veterans' lifetime socioeconomic and health records, this essay finds a consistent and persistent hierarchy in survival rates and hazard ratios by urban size at and across three stages of life: birth, late adolescence, and death. This urban mortality penalty remains after controlling for variables associated with each individual veteran. The results of our geographical mobility analyses suggest that, with respect to these veterans, the search for an explanation should focus on late adolescence and adulthood as much as on early life. A complete explanation of the penalty requires a project of greater scope.
Figures

Notes: Out of 100 population cities in 1860, we selected the cities where more than 6 veterans were born and survived the Civil War. Population size in the panel on the left is log-scaled. City population density in the panel on the right is measured as population per square mile.
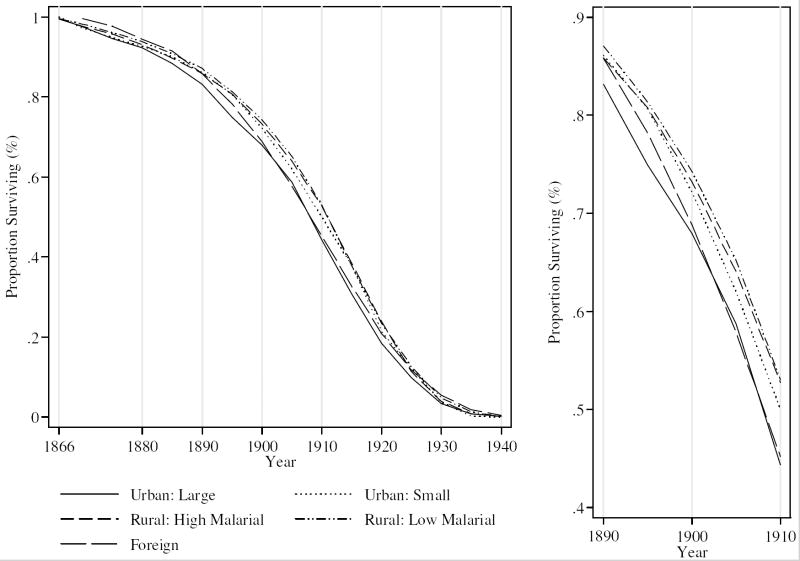
Notes: The survival curves were made for the veterans who survived the Civil War and whose death years are currently known. The panel on the right provides an enlarged view of the period around 1900.

Notes: We limited the sample to veterans who were at 60 or older at the beginning year of each period. The mortality rate is calculated as total deaths during the period out of total veterans alive at the beginning of the period.
References
-
- Barker DJ. Maternal Nutrition, Fetal Nutrition, and Disease in Later Life. Nutrition. 1997;13(9):807–13. - PubMed
-
- Brown JC. Forthcoming. Public health reform and the decline in urban mortality: The case of Germany, 1876-1912. In: Kearns G, Lee WR, Nelson MC, Rogers J, editors. Improving the Public Health: Essays in Medical History. Liverpool, UK: Liverpool University Press;
-
- Cain LP, Rotella EJ. Death and spending: Did urban mortality shocks lead to municipal expenditure increases? Annales de demographie historique. 2001;1:139–54.
-
- Coale A, Demeny P. Regional model life tables and stable populations. New York: Academic; 1983.
-
- Condran GA, Crimmins E. Mortality differentials between rural and urban areas of states in the northeastern United States, 1890-1900. Journal of Historical Geography. 1980;6(2):179–202. - PubMed
Grants and funding
LinkOut - more resources
Full Text Sources