. 2009 Jun 1;42(6):1162-1171.
doi: 10.1016/j.patcog.2008.08.011.

Exploring feature-based approaches in PET images for predicting cancer treatment outcomes

Affiliations

Exploring feature-based approaches in PET images for predicting cancer treatment outcomes

I El Naqa et al. Pattern Recognit. .

Abstract

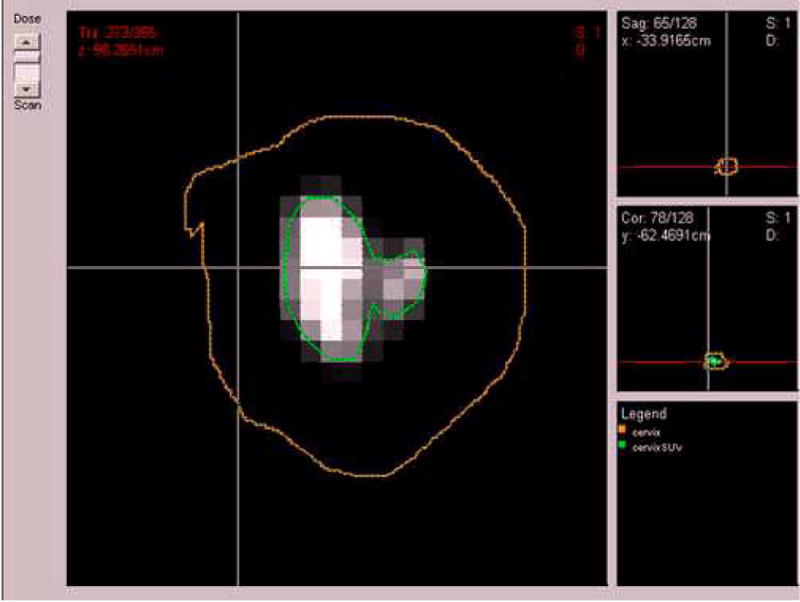
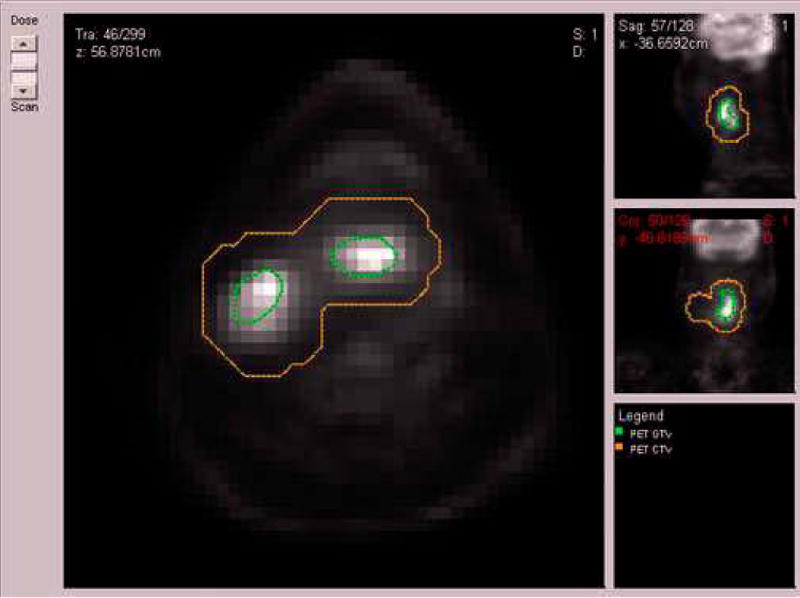
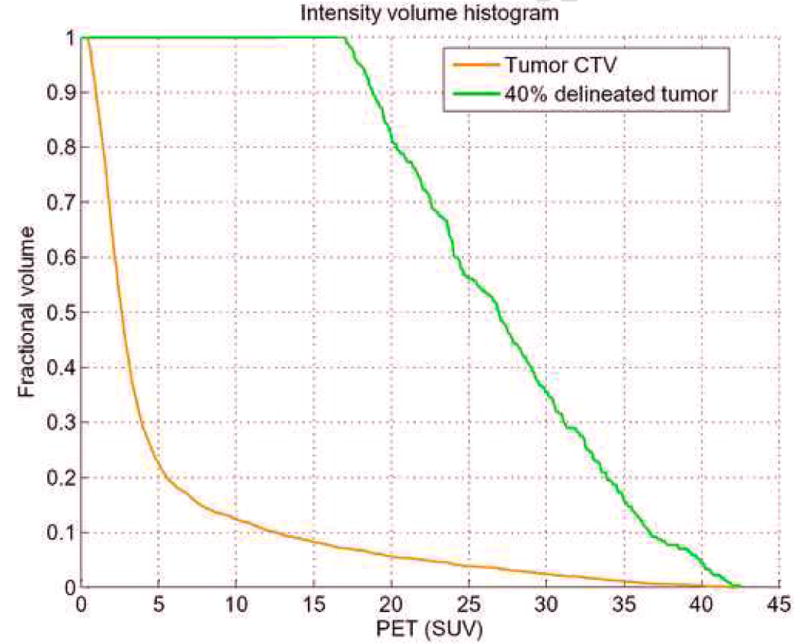
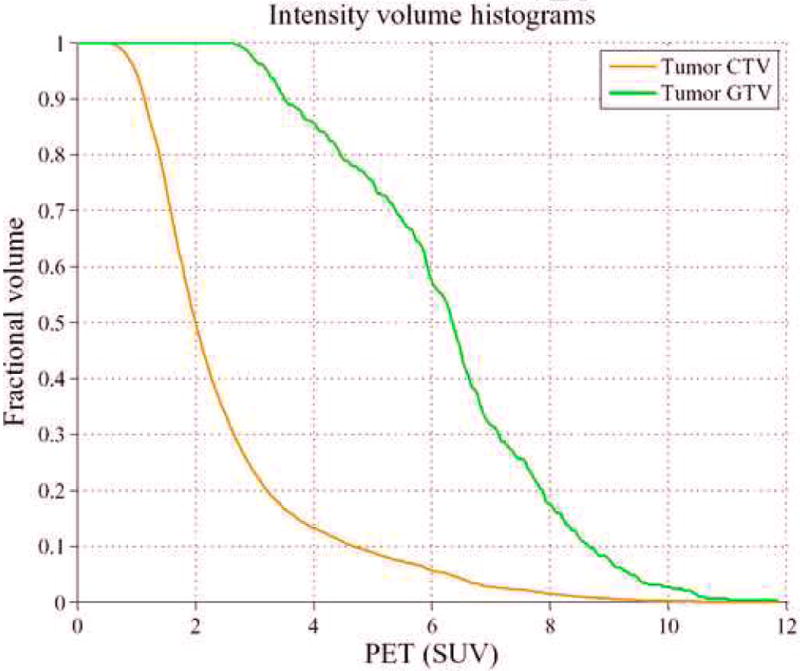
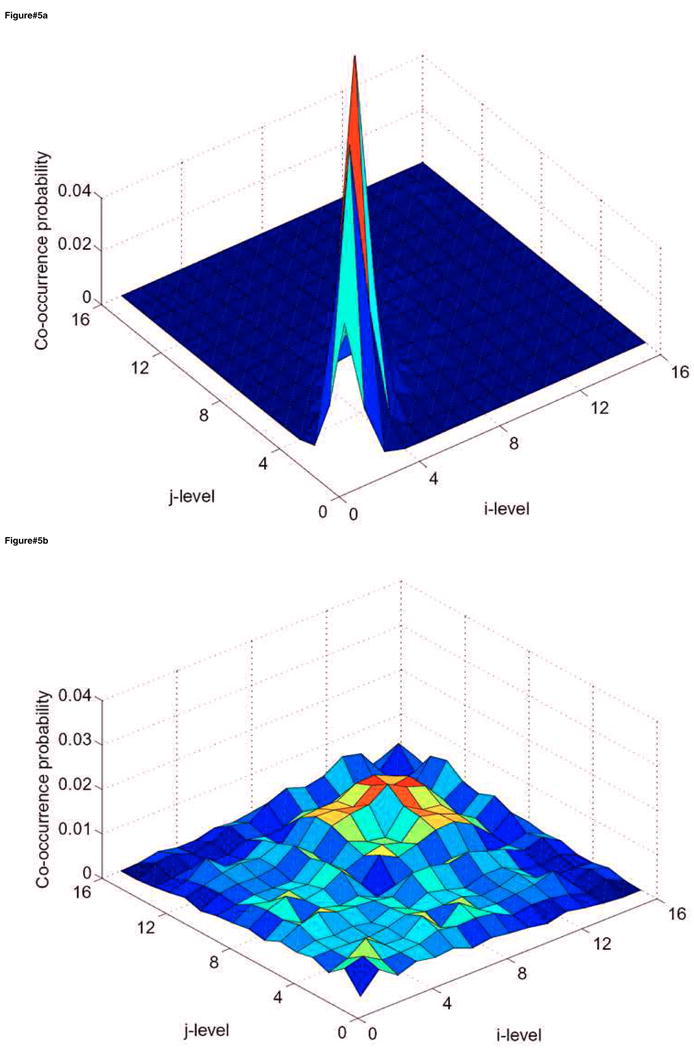
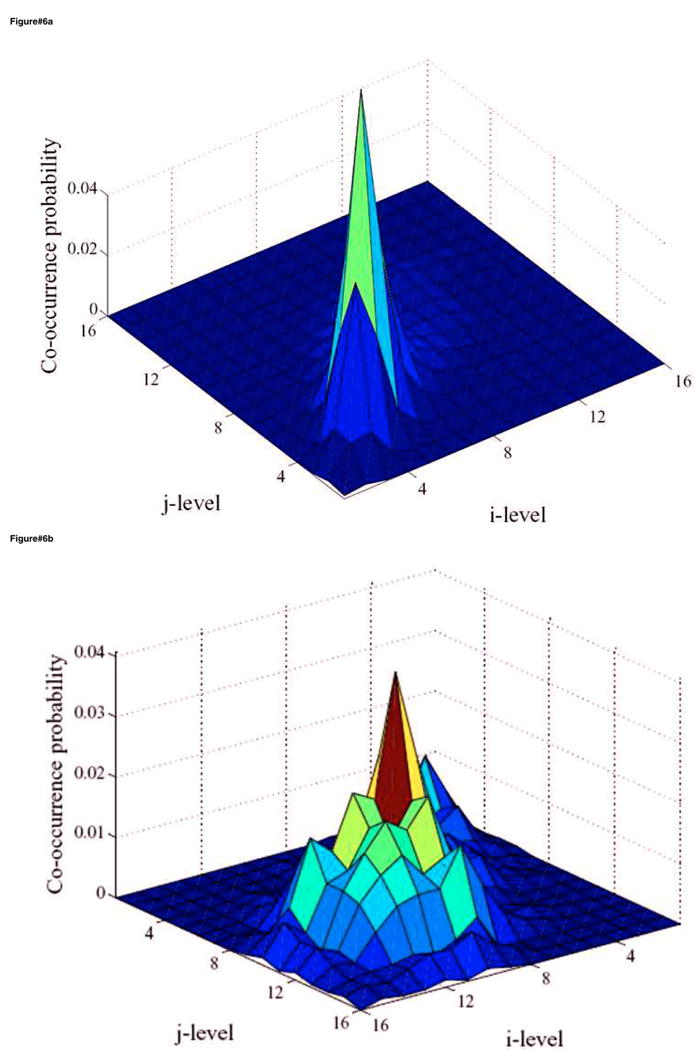
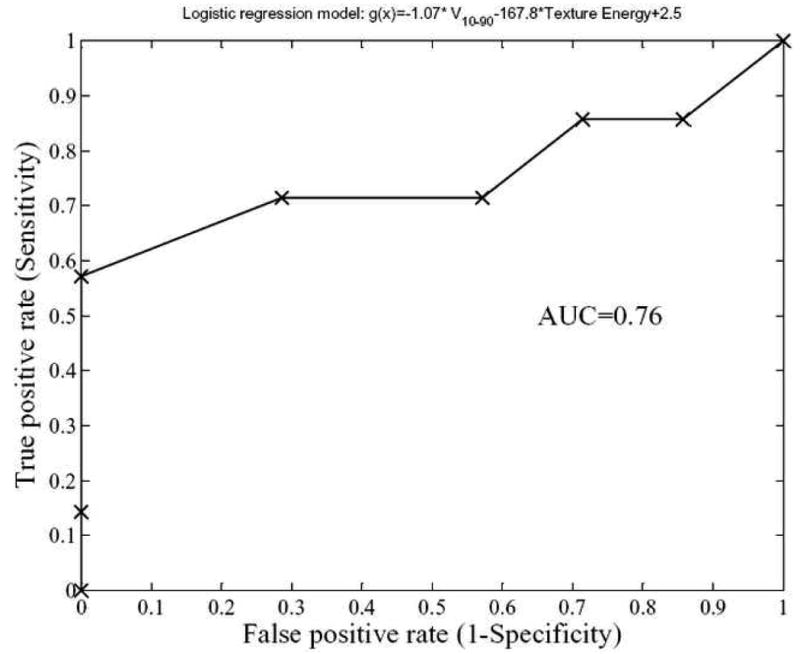
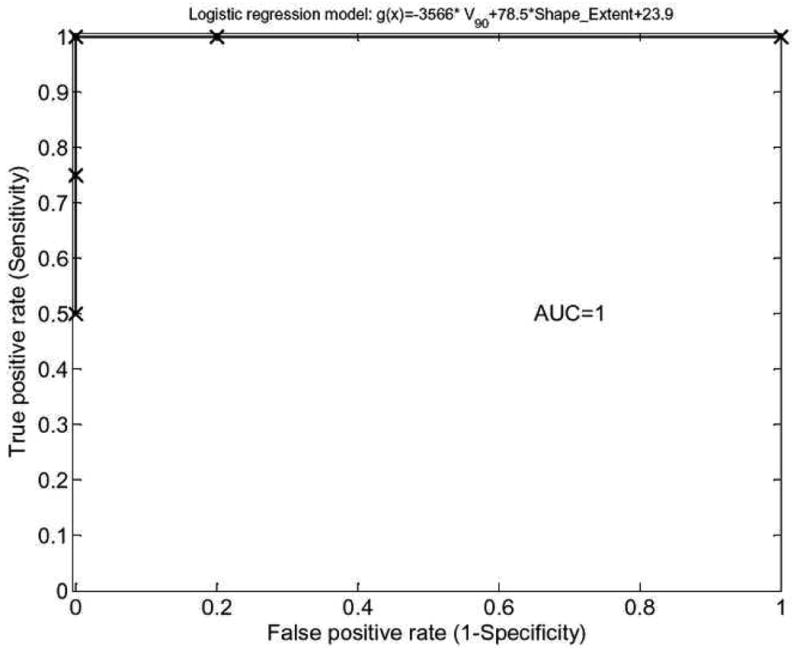
Accumulating evidence suggests that characteristics of pre-treatment FDG-PET could be used as prognostic factors to predict outcomes in different cancer sites. Current risk analyses are limited to visual assessment or direct uptake value measurements. We are investigating intensity-volume histogram metrics and shape and texture features extracted from PET images to predict patient's response to treatment. These approaches were demonstrated using datasets from cervix and head and neck cancers, where AUC of 0.76 and 1.0 were achieved, respectively. The preliminary results suggest that the proposed approaches could potentially provide better tools and discriminant power for utilizing functional imaging in clinical prognosis.


Figures

Figure 1
Figure 1
A pre-treatment PET scan of a cervix cancer case of a patient with persistent tumor at 3 months follow-up post-radiotherapy treatment. The cervix clinical tumor volume (CTV) was outlined by the physician (brown) and the 40% maximum SUV delineated tumor gross volume (GTV) (green).
Figure 2
Figure 2
A pre-treatment PET scan of a head and neck cancer case of patient who died from disease after radiotherapy treatment. The head and neck clinical tumor volume (CTV) (brown) and the gross-tumor volume (GTV) (green) were outlined by the physician.
Figure 3
Figure 3
Intensity volume histogram (IVH) for cervix example showing the IVH plot for the clinical tumor region CTV (brown) and the 40% maximum SUV delineated tumor GTV (green). IVH-derived metrics such as Vx or Ix and their differentials could be extracted for outcome analysis.
Figure 4
Figure 4
Intensity volume histogram (IVH) for the head and neck cancer example showing the IVH plot for the clinical tumor region CTV (brown) and the tumor GTV (green). IVH-derived metrics such as Vx or Ix, and their differentials could be extracted for analyzing outcomes.
Figure 5
Figure 5
Surface plots of the co-occurrence matrix in the case of cervix cancer showing (a) the cervix tumor CTV and (b) 40% maximum SUV delineated tumor GTV. The texture pattern described by the co-occurrence matrix could be utilized to discriminate between homogeneous and heterogeneous tumors uptake. Note that the CTV is relatively smooth while the tumor is showing a ‘noisy’ texture pattern. The number of intensity levels (M) was selected to be 16 in this example.
Figure 6
Figure 6
Surface plots of the co-occurrence matrix in the case of head and neck (H&N) cancer showing (a) the H&N tumor CTV and (b) the delineated tumor GTV. The texture pattern described by the co-occurrence matrix could be utilized to discriminate between homogeneous and heterogeneous tumors uptake. Note that the CTV is again relatively smooth while the tumor is showing a noisy pattern but less than that of the cervix case. The number of intensity levels (M) was selected to be 16 in this example.
Figure 7
Figure 7
Receiver-operating characteristics (ROC) curve of a logistic regression model for cervix outcomes prediction composed of IVH-based and texture Energy. As demonstrated, the model has good prediction power with an area under the ROC curve (AUC) of 0.76.
Figure 8
Figure 8
Receiver-operating characteristics (ROC) curve of a logistic regression model for head and neck outcomes prediction composed of IVH-based and shape extent characteristics. As demonstrated, the model possesses excellent prediction power with an area under the ROC curve (AUC) of 1.

Similar articles

Cited by

References

    1. Biersack HJ, Bender H, Palmedo H. FDG-PET in monitoring therapy of breast cancer. Eur J Nucl Med Mol Imaging. 2004;31 1:S112–7. - PubMed
    1. Bradley J, Thorstad WL, Mutic S, et al. Impact of FDG-PET on radiation therapy volume delineation in non-small-cell lung cancer. Int J Radiat Oncol Biol Phys. 2004;59:78–86. - PubMed
    1. Mutic S, Malyapa RS, Grigsby PW, et al. PET-guided IMRT for cervical carcinoma with positive para-aortic lymph nodes-a dose-escalation treatment planning study. Int J Radiat Oncol Biol Phys. 2003;55:28–35. - PubMed
    1. Brun E, Kjellen E, Tennvall J, et al. FDG PET studies during treatment: prediction of therapy outcome in head and neck squamous cell carcinoma. Head Neck. 2002;24:127–35. - PubMed
    1. Hope AJ, Saha P, Grigsby PW. FDG-PET in carcinoma of the uterine cervix with endometrial extension. Cancer. 2006;106:196–200. - PubMed

LinkOut - more resources