

Electron Transfer Dissociation of Oligonucleotide Cations
- PMID: 20161288
- PMCID: PMC2683025
- DOI: 10.1016/j.ijms.2009.02.012
Electron Transfer Dissociation of Oligonucleotide Cations
Abstract
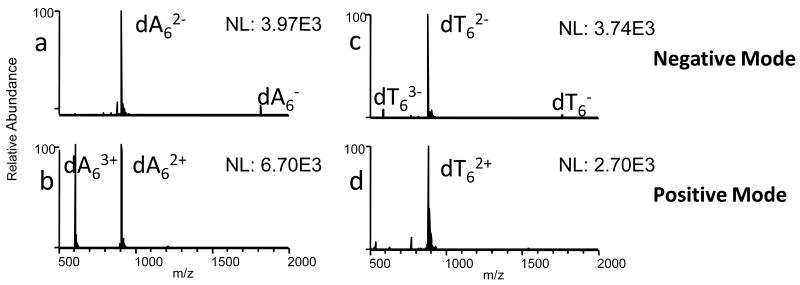
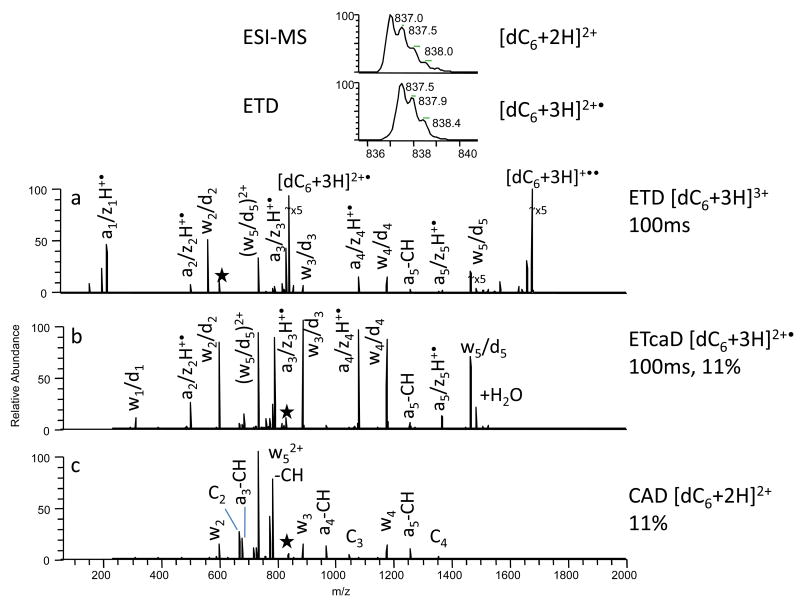
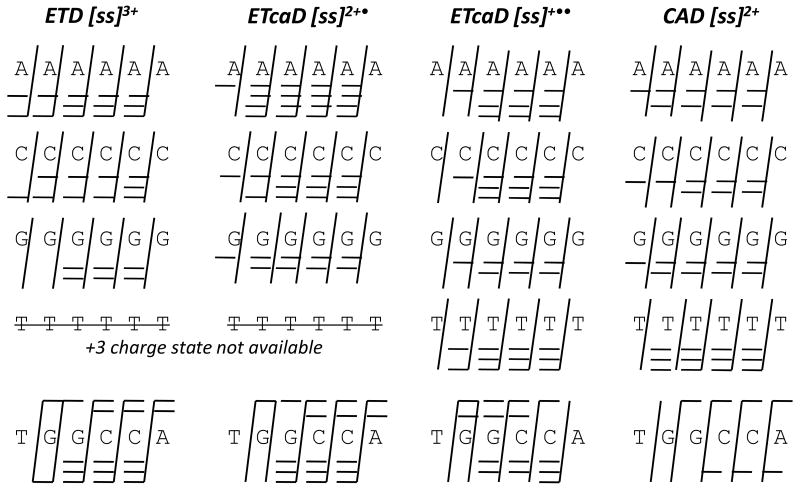
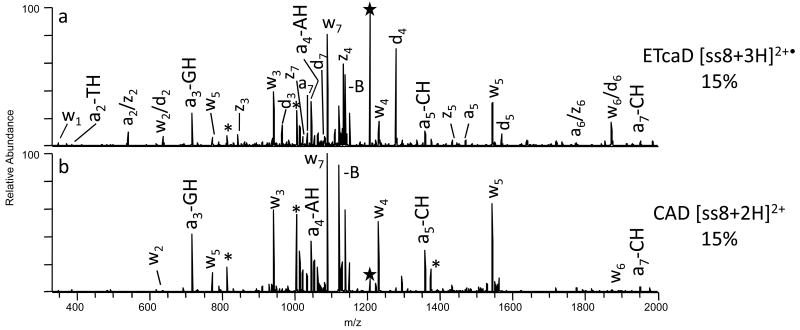
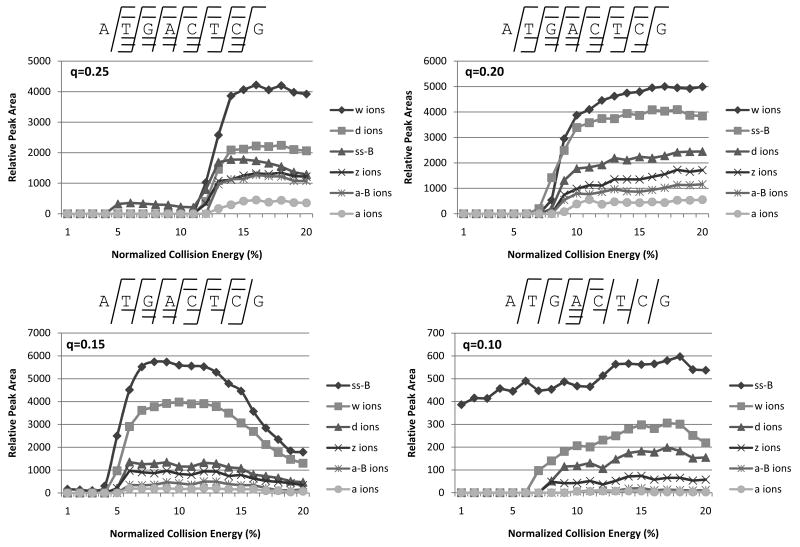
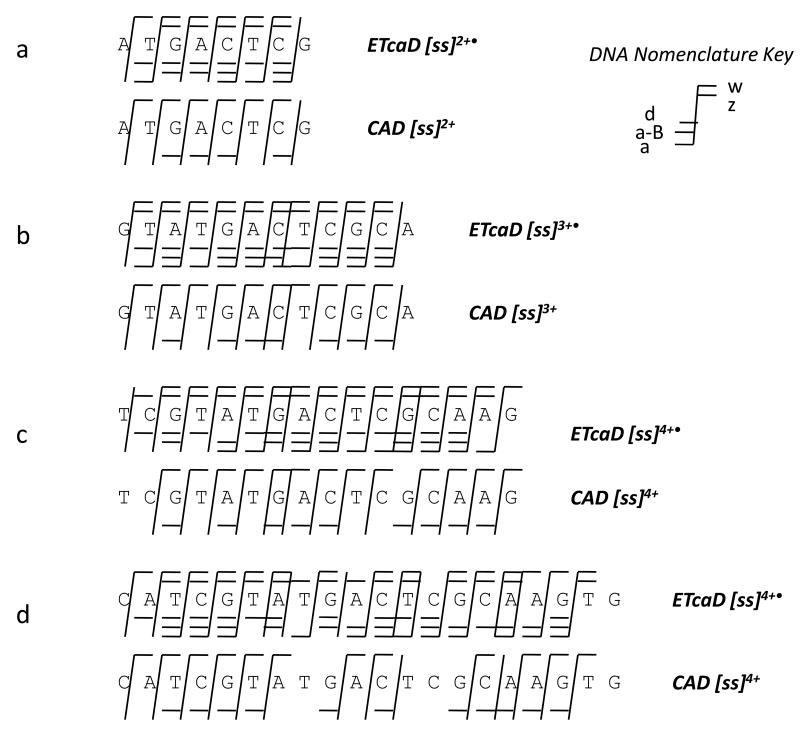
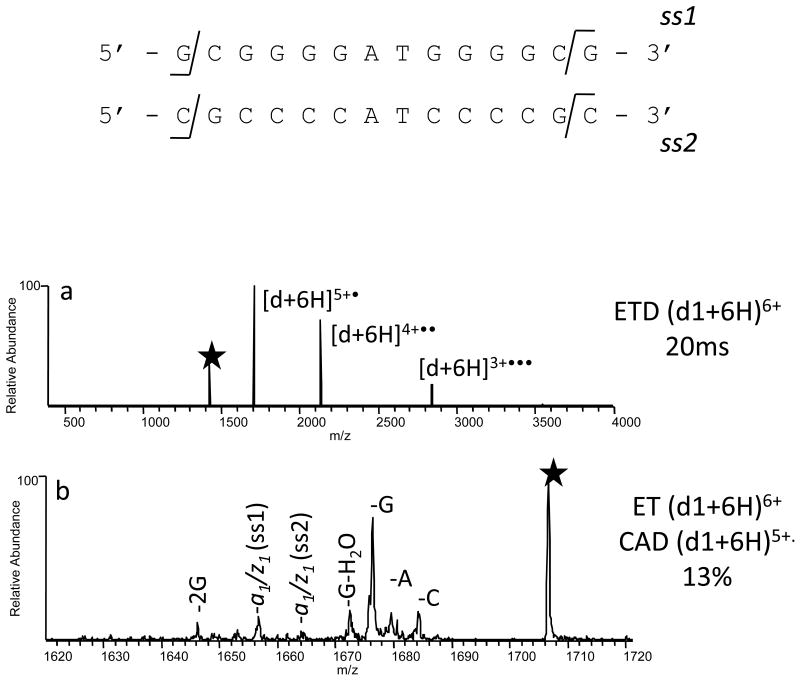
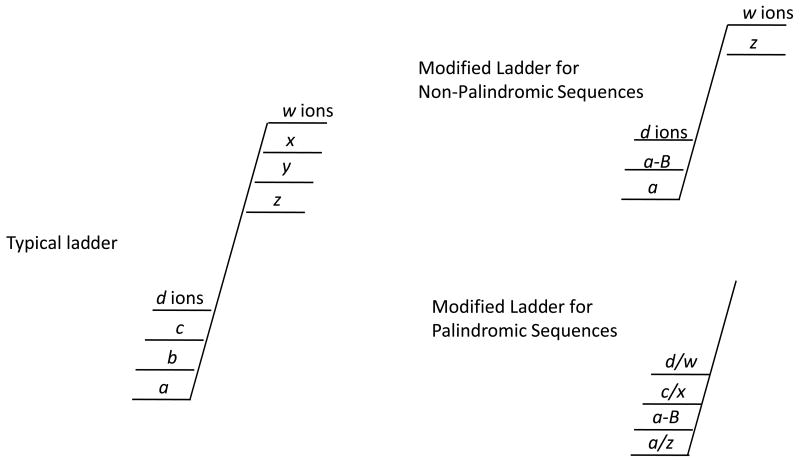
Electron transfer dissociation (ETD) of multi-protonated 6 - 20-mer oligonucleotides and 12- and 14-mer duplexes is compared to collision activated dissociation (CAD). ETD causes efficient charge reduction of the multi-protonated oligonucleotides in addition to limited backbone cleavages to yield sequence ions of low abundance. Subsequent CAD of the charge-reduced oligonucleotides formed upon electron transfer, in a net process termed electron transfer collision activated dissociation (ETcaD), results in rich fragmentation in terms of w, a, z, and d products, with a marked decrease in the abundance of base loss ions and internal fragments. Complete sequencing was possible for nearly all oligonucleotides studied. ETcaD of an oligonucleotide duplex resulted in specific backbone cleavages, with conservation of weaker non-covalent bonds.
Figures


Similar articles
-
What Hinders Electron Transfer Dissociation (ETD) of DNA Cations?J Am Soc Mass Spectrom. 2017 Dec;28(12):2677-2685. doi: 10.1007/s13361-017-1791-z. Epub 2017 Sep 20. J Am Soc Mass Spectrom. 2017. PMID: 28932996
-
Electron transfer followed by collision-induced dissociation (NET-CID) for generating sequence information from backbone-modified oligonucleotide anions.Rapid Commun Mass Spectrom. 2013 Jan 15;27(1):249-57. doi: 10.1002/rcm.6428. Rapid Commun Mass Spectrom. 2013. PMID: 23239339
-
Characterization of oligodeoxynucleotides and modifications by 193 nm photodissociation and electron photodetachment dissociation.Anal Chem. 2010 Sep 1;82(17):7218-26. doi: 10.1021/ac100989q. Anal Chem. 2010. PMID: 20681614 Free PMC article.
-
Supplemental activation method for high-efficiency electron-transfer dissociation of doubly protonated peptide precursors.Anal Chem. 2007 Jan 15;79(2):477-85. doi: 10.1021/ac061457f. Anal Chem. 2007. PMID: 17222010 Free PMC article.
-
Performance characteristics of electron transfer dissociation mass spectrometry.Mol Cell Proteomics. 2007 Nov;6(11):1942-51. doi: 10.1074/mcp.M700073-MCP200. Epub 2007 Aug 1. Mol Cell Proteomics. 2007. PMID: 17673454
Cited by
-
Comparison of MS/MS methods for characterization of DNA/cisplatin adducts.J Am Soc Mass Spectrom. 2013 Feb;24(2):265-73. doi: 10.1007/s13361-012-0532-6. Epub 2012 Dec 20. J Am Soc Mass Spectrom. 2013. PMID: 23264150 Free PMC article.
-
Gas-phase chemistry of multiply charged bioions in analytical mass spectrometry.Annu Rev Anal Chem (Palo Alto Calif). 2010;3:365-85. doi: 10.1146/annurev.anchem.111808.073725. Annu Rev Anal Chem (Palo Alto Calif). 2010. PMID: 20636047 Free PMC article. Review.
-
Increased sequence coverage of thymine-rich oligodeoxynucleotides by infrared multiphoton dissociation compared to collision-induced dissociation.J Mass Spectrom. 2010 Oct;45(10):1098-103. doi: 10.1002/jms.1780. J Mass Spectrom. 2010. PMID: 20648674 Free PMC article.
-
Ribonucleic Acid Sequence Characterization by Negative Electron Transfer Dissociation Mass Spectrometry.Anal Chem. 2020 Mar 17;92(6):4436-4444. doi: 10.1021/acs.analchem.9b05388. Epub 2020 Mar 5. Anal Chem. 2020. PMID: 32091202 Free PMC article.
-
Radical solutions: Principles and application of electron-based dissociation in mass spectrometry-based analysis of protein structure.Mass Spectrom Rev. 2018 Nov;37(6):750-771. doi: 10.1002/mas.21560. Epub 2018 Feb 9. Mass Spectrom Rev. 2018. PMID: 29425406 Free PMC article. Review.
References
-
- Schultz KN, Hakansson K. Int J Mass Spectrom. 2004;234:123.
-
- Hakansson K, Hudgins RR, Marshall AG, O'Hair RAJ. J Am Soc Mass Spectrom. 2003;14:23. - PubMed
-
- Yang J, Hakansson K. Int J Mass Spectrom. 2008;276:144.
-
- Yang J, Mo J, Adamson JT, Hakansson K. Anal Chem. 2005;77:1876. - PubMed
-
- Wu J, McLuckey SA. Int J Mass Spectrom. 2003;228:577.
Grants and funding
LinkOut - more resources
Full Text Sources
Other Literature Sources
Miscellaneous