

Computer-aided Prognosis of Neuroblastoma on Whole-slide Images: Classification of Stromal Development
- PMID: 20161324
- PMCID: PMC2678741
- DOI: 10.1016/j.patcog.2008.08.027
Computer-aided Prognosis of Neuroblastoma on Whole-slide Images: Classification of Stromal Development
Abstract
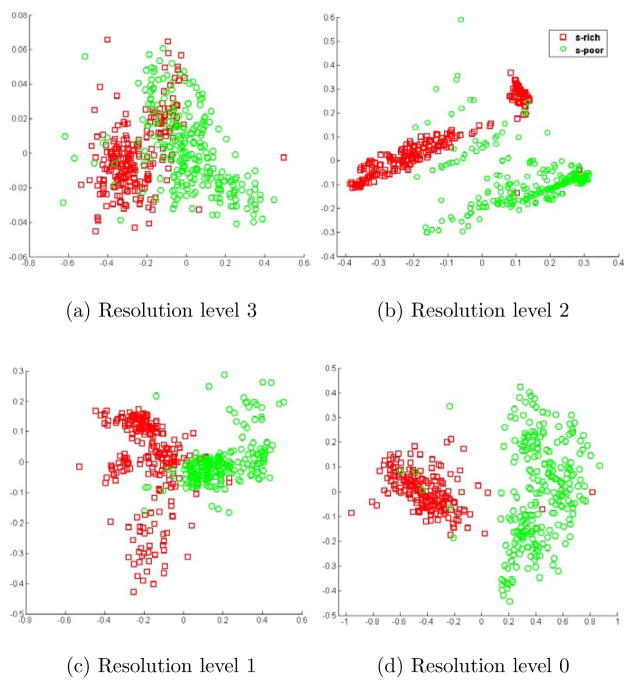
We are developing a computer-aided prognosis system for neuroblastoma (NB), a cancer of the nervous system and one of the most malignant tumors affecting children. Histopathological examination is an important stage for further treatment planning in routine clinical diagnosis of NB. According to the International Neuroblastoma Pathology Classification (the Shimada system), NB patients are classified into favorable and unfavorable histology based on the tissue morphology. In this study, we propose an image analysis system that operates on digitized H&E stained whole-slide NB tissue samples and classifies each slide as either stroma-rich or stroma-poor based on the degree of Schwannian stromal development. Our statistical framework performs the classification based on texture features extracted using co-occurrence statistics and local binary patterns. Due to the high resolution of digitized whole-slide images, we propose a multi-resolution approach that mimics the evaluation of a pathologist such that the image analysis starts from the lowest resolution and switches to higher resolutions when necessary. We employ an offine feature selection step, which determines the most discriminative features at each resolution level during the training step. A modified k-nearest neighbor classifier is used to determine the confidence level of the classification to make the decision at a particular resolution level. The proposed approach was independently tested on 43 whole-slide samples and provided an overall classification accuracy of 88.4%.
Figures


References
-
- American Cancer Society. 2007. http://www.cancer.org.
-
- Shimada H, Ambros IM, Dehner LP, Hata J, Joshi VV, Roald B, Stram DO, Gerbing RB, Lukens JN, Matthay KK, Gastlebery RP. The intl. neuroblastoma pathology classification (the shimada system) Cancer. 1999;86(2):364–372. - PubMed
-
- Shimada H, Ambros IM, Dehner LP, Hata J, Joshi VV, Roald B. Terminology and morphologic criteria of neuroblastic tumors: Recommendation by the international neuroblastoma pathology committee. Cancer. 1999;86(2):349–363. - PubMed
-
- Teao LA, Khayat RSA, Qualman S, Reaman G, Parham D. The problem and promise of central pathology review: Development of a standardized procedure for the children’s oncology group. Pediatric and Developmental Pathology. 2007;10:199–207. - PubMed
-
- Burhenne L, Wood S, DOrsi C, Feig S, Kopans D, Shaughnessy KO, Sickles E, Tabar L, Vyborny C, Castellino R. Potential contribution of computer-aided detection to the sensitivity of screening mammography. Radiology. 2000;215:554–562. - PubMed
Grants and funding
LinkOut - more resources
Full Text Sources
Other Literature Sources