

Resonance Energy Transfer Between Luminescent Quantum Dots and Diverse Fluorescent Protein Acceptors
- PMID: 20161358
- PMCID: PMC2777665
- DOI: 10.1021/jp9060329
Resonance Energy Transfer Between Luminescent Quantum Dots and Diverse Fluorescent Protein Acceptors
Abstract
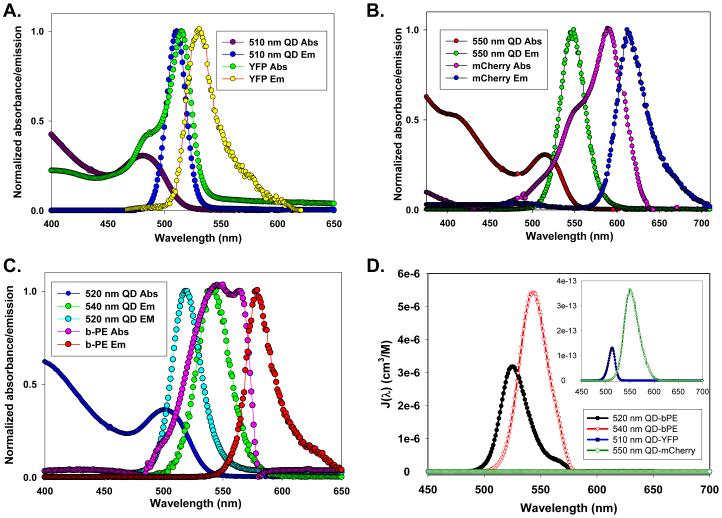
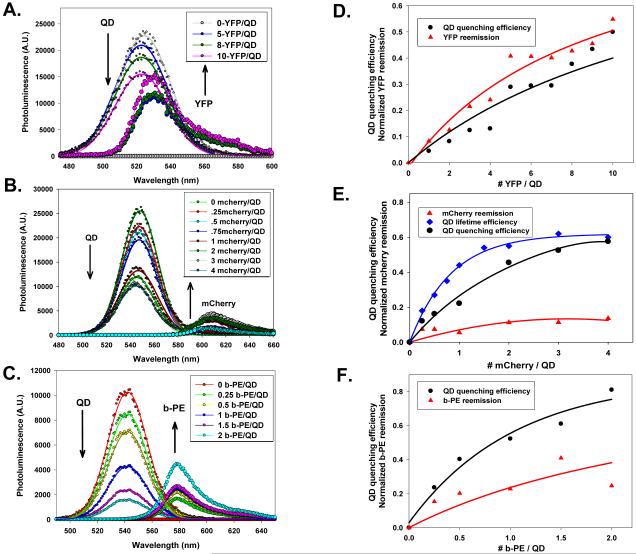
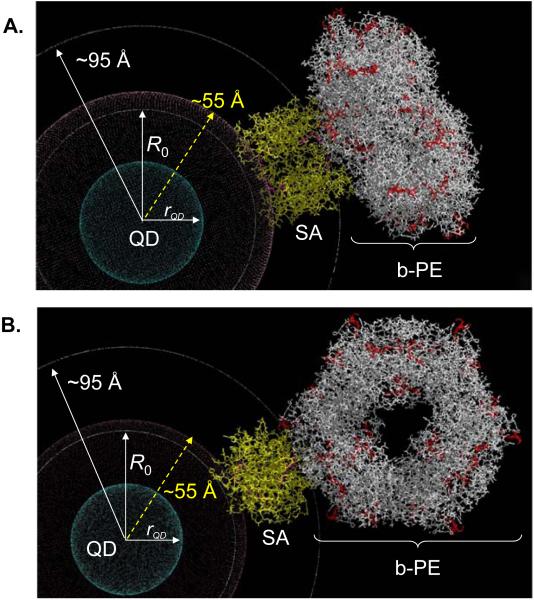
We characterized the resonance energy transfer interactions for conjugates consisting of QD donors self-assembled with three distinct fluorescent protein acceptors: two monomeric fluorescent proteins, the dsRed derivative mCherry or yellow fluorescent protein and the multi-chromophore b-phycoerythrin light harvesting complex. Using steady-state and time-resolved fluorescence, we showed that nonradiative transfer of excitation energy in these conjugates can be described within the Förster dipole-dipole formalism, with transfer efficiencies that vary with the degree of spectral overlap, donor-acceptor separation distance and the number of acceptors per QD. Comparison between the quenching data and simulation of the conjugate structures indicated that while energy transfer to monomeric proteins was identical to what was measured for QD-dye pairs, interactions with b-phycoerythrin were more complex. For the latter, the overall transfer efficiency results from the cumulative contribution of individual channels between the central QD and the chromophores distributed throughout the protein structure. Due to the biocompatible nature of fluorescent proteins, these QD-assemblies may have great potential for use in intracellular imaging and sensing.
Figures


Similar articles
-
Fluorescence resonance energy transfer between quantum dot donors and dye-labeled protein acceptors.J Am Chem Soc. 2004 Jan 14;126(1):301-10. doi: 10.1021/ja037088b. J Am Chem Soc. 2004. PMID: 14709096
-
Self-assembled donor comprising quantum dots and fluorescent proteins for long-range fluorescence resonance energy transfer.J Am Chem Soc. 2008 Apr 9;130(14):4815-27. doi: 10.1021/ja078243f. Epub 2008 Mar 14. J Am Chem Soc. 2008. PMID: 18338889
-
On the quenching of semiconductor quantum dot photoluminescence by proximal gold nanoparticles.Nano Lett. 2007 Oct;7(10):3157-64. doi: 10.1021/nl071729+. Epub 2007 Sep 11. Nano Lett. 2007. PMID: 17845066
-
Förster resonance energy transfer investigations using quantum-dot fluorophores.Chemphyschem. 2006 Jan 16;7(1):47-57. doi: 10.1002/cphc.200500217. Chemphyschem. 2006. PMID: 16370019 Review.
-
Förster Resonance Energy Transfer between Quantum Dot Donors and Quantum Dot Acceptors.Sensors (Basel). 2015 Jun 5;15(6):13288-325. doi: 10.3390/s150613288. Sensors (Basel). 2015. PMID: 26057041 Free PMC article. Review.
Cited by
-
Spatiotemporal Measurement of Osmotic Pressures by FRET Imaging.Angew Chem Int Ed Engl. 2021 Mar 15;60(12):6488-6495. doi: 10.1002/anie.202011983. Epub 2021 Feb 3. Angew Chem Int Ed Engl. 2021. PMID: 33188706 Free PMC article.
-
Fabrication of multiresponsive bioactive nanocapsules through orthogonal self-assembly.Angew Chem Int Ed Engl. 2014 May 12;53(20):5137-41. doi: 10.1002/anie.201400559. Epub 2014 Apr 1. Angew Chem Int Ed Engl. 2014. PMID: 24692293 Free PMC article.
-
Preparation of compact biocompatible quantum dots using multicoordinating molecular-scale ligands based on a zwitterionic hydrophilic motif and lipoic acid anchors.Nat Protoc. 2015 Jun;10(6):859-74. doi: 10.1038/nprot.2015.050. Epub 2015 May 14. Nat Protoc. 2015. PMID: 25974095
-
Selecting improved peptidyl motifs for cytosolic delivery of disparate protein and nanoparticle materials.ACS Nano. 2013 May 28;7(5):3778-96. doi: 10.1021/nn400702r. ACS Nano. 2013. PMID: 23710591 Free PMC article.
-
Extending Förster resonance energy transfer measurements beyond 100 Å using common organic fluorophores: enhanced transfer in the presence of multiple acceptors.J Biomed Opt. 2012 Jan;17(1):011006. doi: 10.1117/1.JBO.17.1.011006. J Biomed Opt. 2012. PMID: 22352640 Free PMC article.
References
-
- Lidke DS, Nagy P, Heintzmann R, Arndt-Jovin DJ, Post JN, Grecco HE, Jares-Erijman EA, Jovin TM. Quantum dot ligands provide new insights into erbB/HER receptor-mediated signal transduction. Nat. Biotechnol. 2004;22:198–203. - PubMed
-
- Delehanty JB, Mattoussi H, Medintz IL. Delivering quantum dots into cells: strategies, progress and remaining issues. Anal. Bioanal. Chem. 2009;393(4):1091–1105. - PubMed
-
- Medintz I, Uyeda H, Goldman E, Mattoussi H. Quantum dot bioconjugates for imaging, labeling and sensing. Nat. Mater. 2005;4:435–446. - PubMed
-
- Alivisatos AP, Gu W, Larabell CA. Quantum dots as cellular probes. Annu. Rev. Biomed. Eng. 2005;7:55–76. - PubMed
Grants and funding
LinkOut - more resources
Full Text Sources
Other Literature Sources