

Intensity Standardization Simplifies Brain MR Image Segmentation
- PMID: 20161360
- PMCID: PMC2777695
- DOI: 10.1016/j.cviu.2009.06.003
Intensity Standardization Simplifies Brain MR Image Segmentation
Abstract
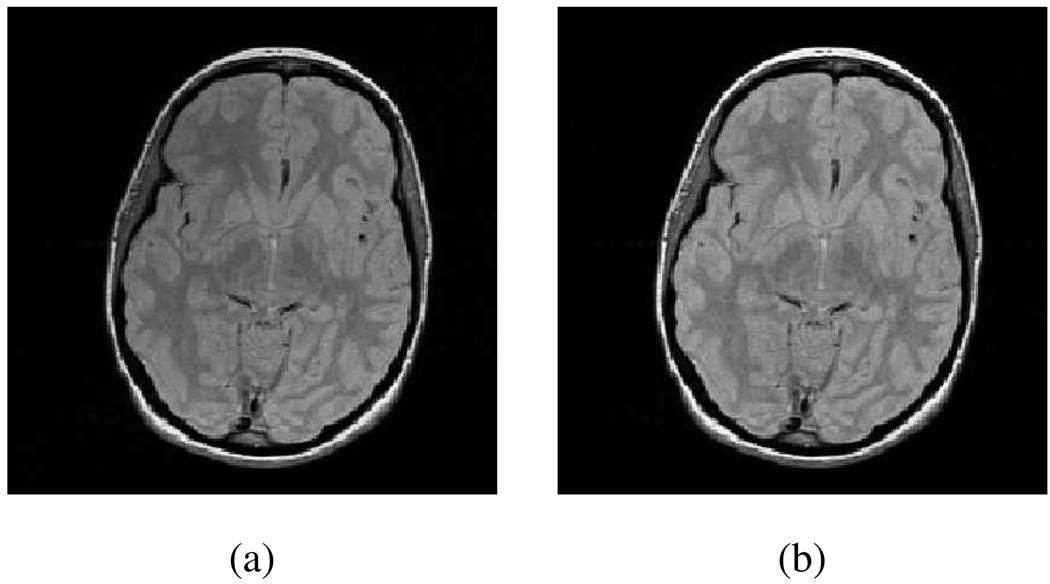
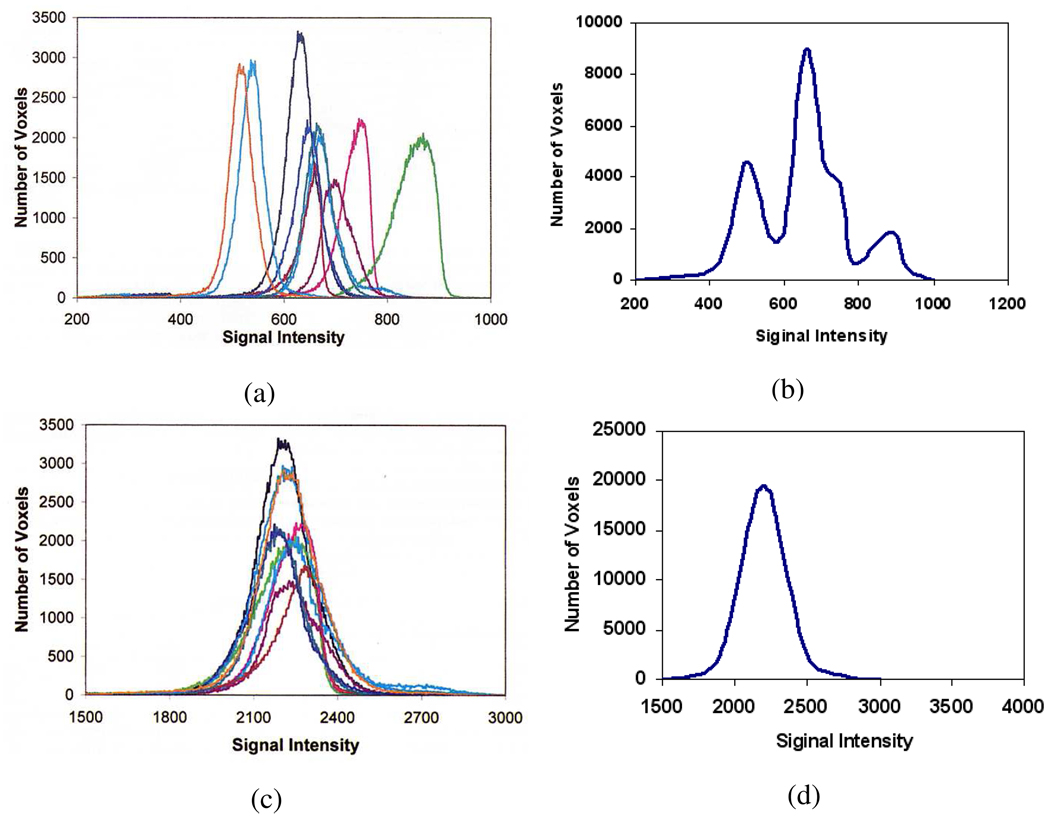
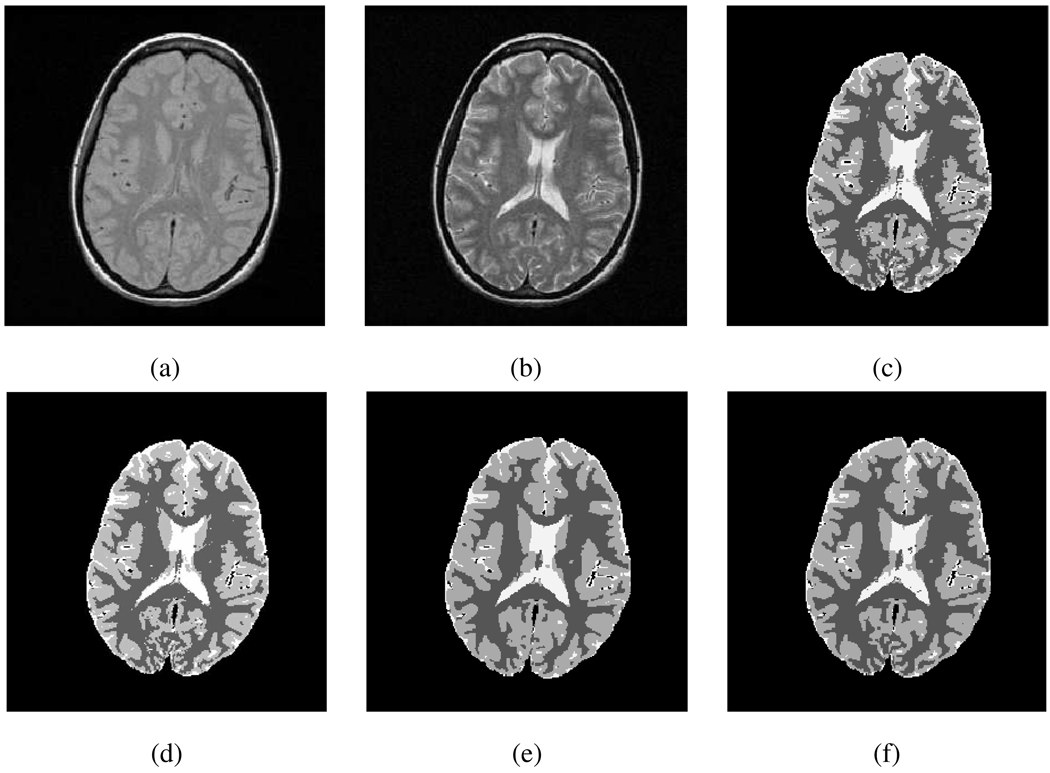
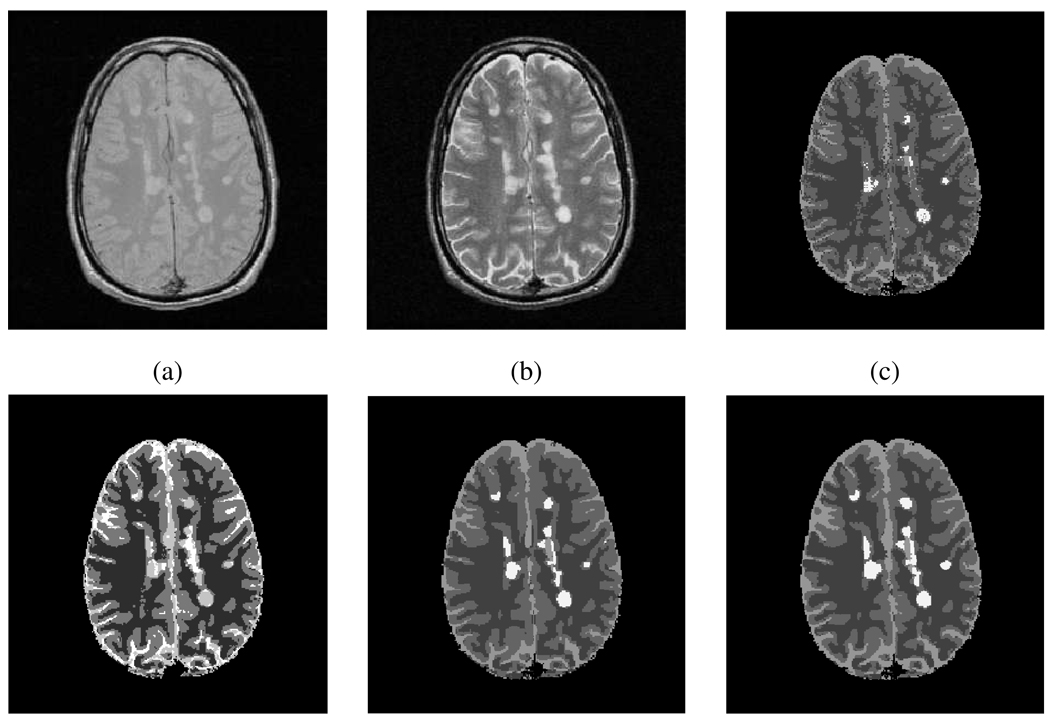
Typically, brain MR images present significant intensity variation across patients and scanners. Consequently, training a classifier on a set of images and using it subsequently for brain segmentation may yield poor results. Adaptive iterative methods usually need to be employed to account for the variations of the particular scan. These methods are complicated, difficult to implement and often involve significant computational costs. In this paper, a simple, non-iterative method is proposed for brain MR image segmentation. Two preprocessing techniques, namely intensity inhomogeneity correction, and more importantly MR image intensity standardization, used prior to segmentation, play a vital role in making the MR image intensities have a tissue-specific numeric meaning, which leads us to a very simple brain tissue segmentation strategy.Vectorial scale-based fuzzy connectedness and certain morphological operations are utilized first to generate the brain intracranial mask. The fuzzy membership value of each voxel within the intracranial mask for each brain tissue is then estimated. Finally, a maximum likelihood criterion with spatial constraints taken into account is utilized in classifying all voxels in the intracranial mask into different brain tissue groups. A set of inhomogeneity corrected and intensity standardized images is utilized as a training data set. We introduce two methods to estimate fuzzy membership values. In the first method, called SMG (for simple membership based on a gaussian model), the fuzzy membership value is estimated by fitting a multivariate Gaussian model to the intensity distribution of each brain tissue whose mean intensity vector and covariance matrix are estimated and fixed from the training data sets. The second method, called SMH (for simple membership based on a histogram), estimates fuzzy membership value directly via the intensity distribution of each brain tissue obtained from the training data sets. We present several studies to evaluate the performance of these two methods based on 10 clinical MR images of normal subjects and 10 clinical MR images of Multiple Sclerosis (MS) patients. A quantitative comparison indicates that both methods have overall better accuracy than the k-nearest neighbors (kNN) method, and have much better efficiency than the Finite Mixture (FM) model based Expectation-Maximization (EM) method. Accuracy is similar for our methods and EM method for the normal subject data sets, but much better for our methods for the patient data sets.
Figures
Similar articles
-
Robust generative asymmetric GMM for brain MR image segmentation.Comput Methods Programs Biomed. 2017 Nov;151:123-138. doi: 10.1016/j.cmpb.2017.08.017. Epub 2017 Aug 24. Comput Methods Programs Biomed. 2017. PMID: 28946994
-
Partial volume segmentation of brain magnetic resonance images based on maximum a posteriori probability.Med Phys. 2005 Jul;32(7Part1):2337-2345. doi: 10.1118/1.1944912. Med Phys. 2005. PMID: 28493585
-
Spatial Fuzzy C Means and Expectation Maximization Algorithms with Bias Correction for Segmentation of MR Brain Images.J Med Syst. 2017 Jan;41(1):15. doi: 10.1007/s10916-016-0662-7. Epub 2016 Dec 13. J Med Syst. 2017. PMID: 27966093
-
Intensity inhomogeneity correction for the breast sonogram: constrained fuzzy cell-based bipartitioning and polynomial surface modeling.Med Phys. 2010 Nov;37(11):5645-54. doi: 10.1118/1.3488944. Med Phys. 2010. PMID: 21158276
-
Review of MR image segmentation techniques using pattern recognition.Med Phys. 1993 Jul-Aug;20(4):1033-48. doi: 10.1118/1.597000. Med Phys. 1993. PMID: 8413011 Review.
Cited by
-
Body-wide hierarchical fuzzy modeling, recognition, and delineation of anatomy in medical images.Med Image Anal. 2014 Jul;18(5):752-71. doi: 10.1016/j.media.2014.04.003. Epub 2014 Apr 24. Med Image Anal. 2014. PMID: 24835182 Free PMC article.
-
Fuzzy logic: A "simple" solution for complexities in neurosciences?Surg Neurol Int. 2011 Feb 26;2:24. doi: 10.4103/2152-7806.77177. Surg Neurol Int. 2011. PMID: 21541006 Free PMC article.
-
A Contrast Augmentation Approach to Improve Multi-Scanner Generalization in MRI.Front Neurosci. 2021 Aug 31;15:708196. doi: 10.3389/fnins.2021.708196. eCollection 2021. Front Neurosci. 2021. PMID: 34531715 Free PMC article.
-
Minimally interactive segmentation of 4D dynamic upper airway MR images via fuzzy connectedness.Med Phys. 2016 May;43(5):2323. doi: 10.1118/1.4945698. Med Phys. 2016. PMID: 27147344 Free PMC article.
-
Post-acquisition standardization of positron emission tomography images.Front Nucl Med. 2023;3:1210931. doi: 10.3389/fnume.2023.1210931. Epub 2023 Sep 11. Front Nucl Med. 2023. PMID: 39015756 Free PMC article.
References
-
- Pal NR, Pal SK. A review of image segmentation techniques. Pattern Recognition. 1993;26(9):1277–1294.
-
- Pham D, Xu C, Prince J. Current methods in medical image segmentation. Annual Review of Biomedical Engineering. 2000;2:315–337. - PubMed
-
- Wells WM, Grimson EL, Kikinis R, Jolesz FA. Adaptive segmentation of MRI data. IEEE Transactions on Medical Imaging. 1996;15(4):429–442. - PubMed
-
- Guillemaud R, Brady M. Estimating the bias field of MR images. IEEE Transactions on Medical Imaging. 1997;16(3):238–251. - PubMed
-
- Van Leemput K, Maes F, Vandermeulen D, Suetens P. Automated model-based bias field correction of MR images of the brain. IEEE Transactions on Medical Imaging. 1999;18(10):885–896. - PubMed
Grants and funding
LinkOut - more resources
Full Text Sources
Other Literature Sources