

doi: 10.1016/j.trac.2009.08.005.
Chemical measurements in Drosophila
Affiliations
- PMID: 20161412
- PMCID: PMC2786087
- DOI: 10.1016/j.trac.2009.08.005
Item in Clipboard
Chemical measurements in Drosophila
Trends Analyt Chem.
.
Abstract
The fruit fly, Drosophila melanogaster, has been extensively used as a model organism in genetics research and has significantly contributed to understanding molecular, cellular and evolutionary aspects of human behavior. Recently, research has focused on developing analytical methods to obtain highly sensitive chemical quantification along with spatiotemporal information from Drosophila melanogaster. We review a number of these advances in capillary electrophoresis, high-performance liquid chromatography, mass spectrometry and technologies involving intact organisms, including in vivo electrochemistry.
Figures
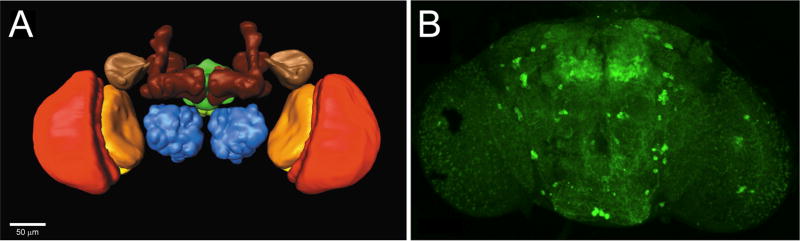
Drosophila brain regions. (A) A polygonal model of the Drosophila melanogaster brain. Major neuropil regions are highlighted in color (brown = mushroom body; beige = lateral horn; blue = antennal lobe; green = central complex; red = medulla; orange = lobula; yellow = lobula plate). Scale bar, 50 μm. (B) Tyrosine hydroxylase immunolabeling showing dopaminergic neuron patterns in multifocal confocal views of adult-fly brain. (Reprinted from [63,64], with permission from Elsevier and the Society for Neuroscience).
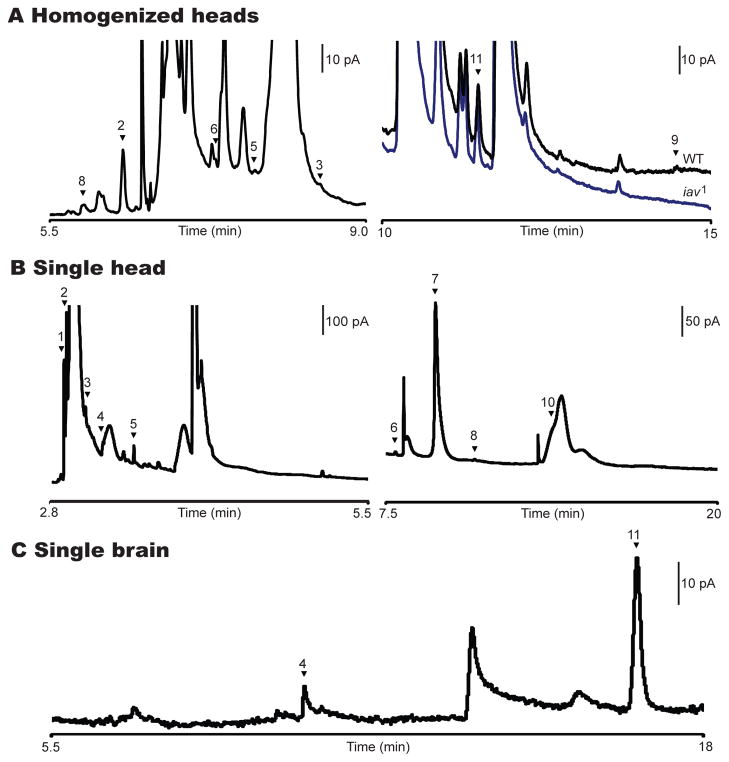
MEKC-EC separations of homogenates from Drosophila. (A) Enlarged portion of an electropherogram (left) includes peaks naOA (2), naDA (3), na5-HT (5), OA (6), DA (8). Electropherogram (right) compares wild-type (WT - black trace) and mutant (iav1 - blue trace) Drosophila head homogenates emphasizing the internal standard CAT (11) and TA (9). Separation was run with borate buffer. There is no detectable level of TA in the mutant form. (B) Electropherogram of a single head with TES running buffer highlighting L-DOPA (1), naOA (2), naDA (3), naTA (4), na5-HT (5), OA (6), DHBA (7), DA (8), 5-HT (10). TA (9) is not visible on this scale. (C) Electropherogram of hand-dissected brain where naTA (4) and CAT (11) are visible. The working electrode was held at +750 mV vs. an Ag/AgCl reference electrode for all separations. (Reprinted from [21,24], with permission from the American Chemical Society).
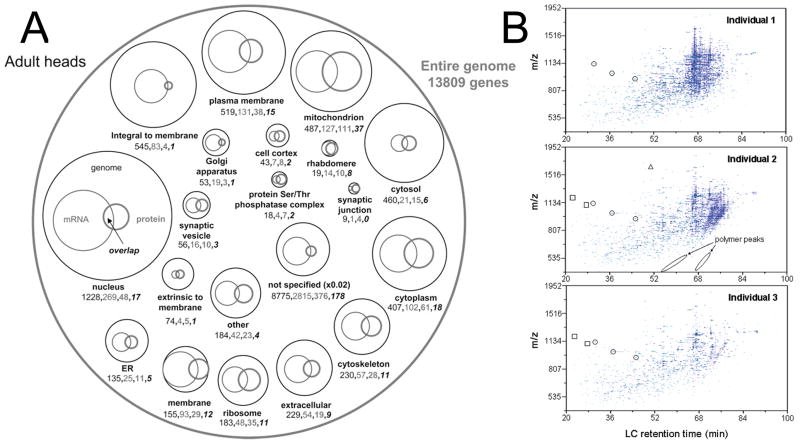
Mass-spectrometric measurements of the Drosophila proteome. (A) Venn diagram of the known adult Drosophila genome (thin black circles and numbers), mRNA transcripts (thin grey circles and numbers), proteome (thick grey circles and bold numbers), and the overlap between mRNA transcripts and proteome (bold black Italic numbers). Circle size corresponds to the number of known genes, transcripts, and proteins listed below the circle. (B) LC-IMS-MS analysis of three digested individual flies. Many of these features are common within all three individuals but some examples of the differences have been labeled. Circled features designate peptides found in all three individuals, boxes only two individuals, and triangles only one individual. (Reprinted from [35,36], with permission from the American Chemical Society).
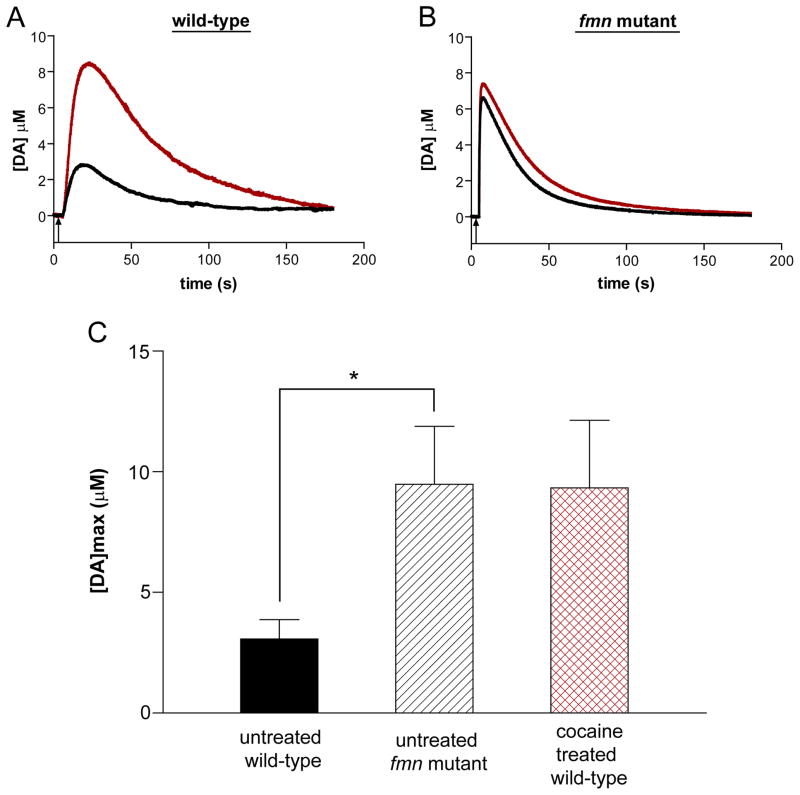
Investigating dopamine-transporter function. (A) Representative concentration trace of exogenously applied 1.0 mM dopamine in wild-type Drosophila before (black line) and after (red line) cocaine application. An increase in dopamine concentration in the adult wild-type fly was observed following a 5 min exposure to 1.0 mM cocaine. Black arrow corresponds to a 1.0 s dopamine application beginning at 5.0 s. (B) Representative concentration trace of exogenously applied 1.0 mM dopamine in the fmn mutant before (black line) and after (red line) cocaine application. No significant change was observed in the adult fmn mutant fly. (C) Comparison of baseline [DA]max for the untreated wild-type and fmn mutant (mean ± SEM; Student’s t-test, p = 0.02 (*), n = 9) and the treated wild-type fly after application of 1.0 mM cocaine. The difference in [DA]max between untreated fmn mutants and wild-type flies treated with cocaine is not significantly different (mean ± SEM; Student’s t-test, p = 1.0, n = 6–9).
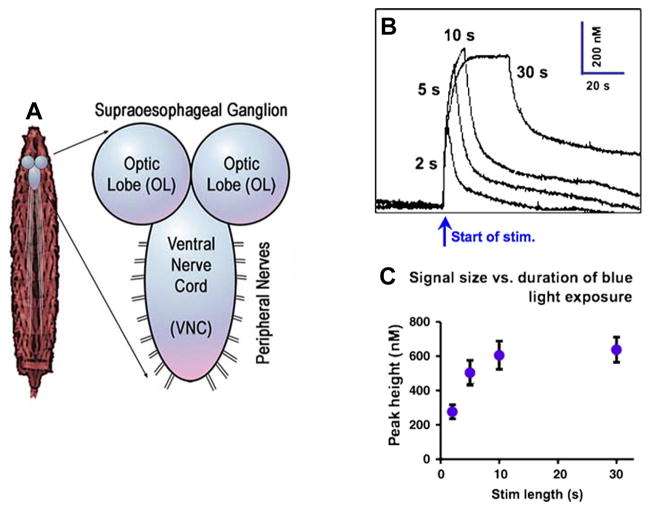
In vivo measurements in Drosophila larvae following optical stimulation. (A) Diagram of neuromuscular anatomy of a third-instar larva. (B) Representative traces of evoked peak serotonin concentration varying with duration of blue-light stimulus (2, 5, 10, and 30 s). (C) Pooled data (mean ± SEM, n = 6) shows an increase in peak height with increasing duration of blue-light exposure. Peak height appears to plateau after 10 s; peak height at 30 s is not significantly different from that at 10 s (Student’s t-test, 2 tailed, p = 0.78). (Reprinted from [52,54], with permission from the Society for Neuroscience and Elsevier).
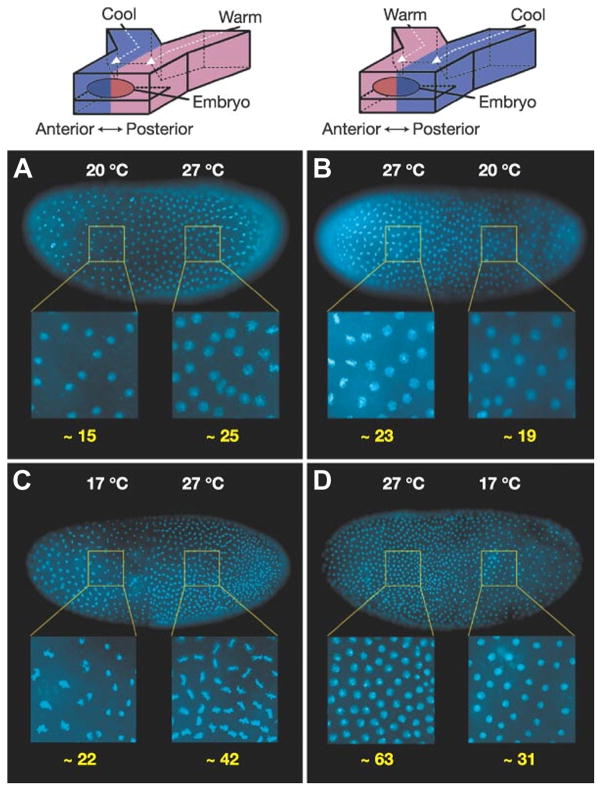
Microfluidic devices in the analysis of Drosophila embryos. The rate of development in each half of the embryo exposed to a T-step is affected by temperature, as demonstrated by the difference in nuclear density (number of nuclei in enlarged areas shown underneath in yellow numbering). (A, B) Embryos exposed to a T-step of 20°C/27°C for 140 min. (A) Anterior half 20°C, posterior half 27°C. (B) Anterior half 27°C, posterior half 20°C. (C, D) Identical set-up to A and B with embryos exposed to a greater T-step of 17°C/27°C for 150 min. In all images, higher nuclear density was observed in the warmer half of the embryo. (Reprinted from [60], with permission from Nature Publishing Group).
Similar articles
-
Micellar capillary electrophoresis--electrochemical detection of neurochemicals from Drosophila.J Sep Sci. 2010 Feb;33(3):388-93. doi: 10.1002/jssc.200900634. J Sep Sci. 2010. PMID: 20063357
-
Fly-on-a-Chip: Microfluidics for Drosophila melanogaster Studies.Integr Biol (Camb). 2019 Dec 31;11(12):425-443. doi: 10.1093/intbio/zyz037. Integr Biol (Camb). 2019. PMID: 31965192 Review.
-
Drosophila as a Model System for Neurotransmitter Measurements.ACS Chem Neurosci. 2018 Aug 15;9(8):1872-1883. doi: 10.1021/acschemneuro.7b00456. Epub 2018 Feb 20. ACS Chem Neurosci. 2018. PMID: 29411967 Free PMC article. Review.
-
[Advances in chiral separation and analysis by capillary electrophoresis-mass spectrometry].Se Pu. 2022 Jun;40(6):509-519. doi: 10.3724/SP.J.1123.2021.11006. Se Pu. 2022. PMID: 35616196 Free PMC article. Review. Chinese.
-
Translational Metabolomics of Head Injury: Exploring Dysfunctional Cerebral Metabolism with Ex Vivo NMR Spectroscopy-Based Metabolite Quantification.In: Kobeissy FH, editor. Brain Neurotrauma: Molecular, Neuropsychological, and Rehabilitation Aspects. Boca Raton (FL): CRC Press/Taylor & Francis; 2015. Chapter 25. In: Kobeissy FH, editor. Brain Neurotrauma: Molecular, Neuropsychological, and Rehabilitation Aspects. Boca Raton (FL): CRC Press/Taylor & Francis; 2015. Chapter 25. PMID: 26269925 Free Books & Documents. Review.
Cited by
-
Oral administration of methylphenidate blocks the effect of cocaine on uptake at the Drosophila dopamine transporter.ACS Chem Neurosci. 2013 Apr 17;4(4):566-74. doi: 10.1021/cn3002009. Epub 2013 Feb 25. ACS Chem Neurosci. 2013. PMID: 23402315 Free PMC article.
-
Anti-obesity effects of Erythrina abyssinica stem bark extract in flies exposed to a high fat diet.Heliyon. 2022 Jul 6;8(7):e09886. doi: 10.1016/j.heliyon.2022.e09886. eCollection 2022 Jul. Heliyon. 2022. PMID: 35847607 Free PMC article.
-
Using In Vivo Electrochemistry to Study the Physiological Effects of Cocaine and Other Stimulants on the Drosophila melanogaster Dopamine Transporter.ACS Chem Neurosci. 2010 Jan 20;1(1):74-83. doi: 10.1021/cn900017w. ACS Chem Neurosci. 2010. PMID: 20352129 Free PMC article.
-
Neuronal identity control at the resolution of a single transcription factor isoform.bioRxiv [Preprint]. 2024 Jun 14:2024.06.14.598883. doi: 10.1101/2024.06.14.598883. bioRxiv. 2024. PMID: 38915533 Free PMC article. Preprint.
References
Grants and funding
LinkOut - more resources
Full Text Sources
Molecular Biology Databases