

doi: 10.1016/j.pnmrs.2009.06.002.
Studying Enzymes by In Vivo C Magnetic Resonance Spectroscopy
Affiliations
- PMID: 20161496
- PMCID: PMC2796782
- DOI: 10.1016/j.pnmrs.2009.06.002
Item in Clipboard
Studying Enzymes by In Vivo C Magnetic Resonance Spectroscopy
Prog Nucl Magn Reson Spectrosc.
.
No abstract available
Figures
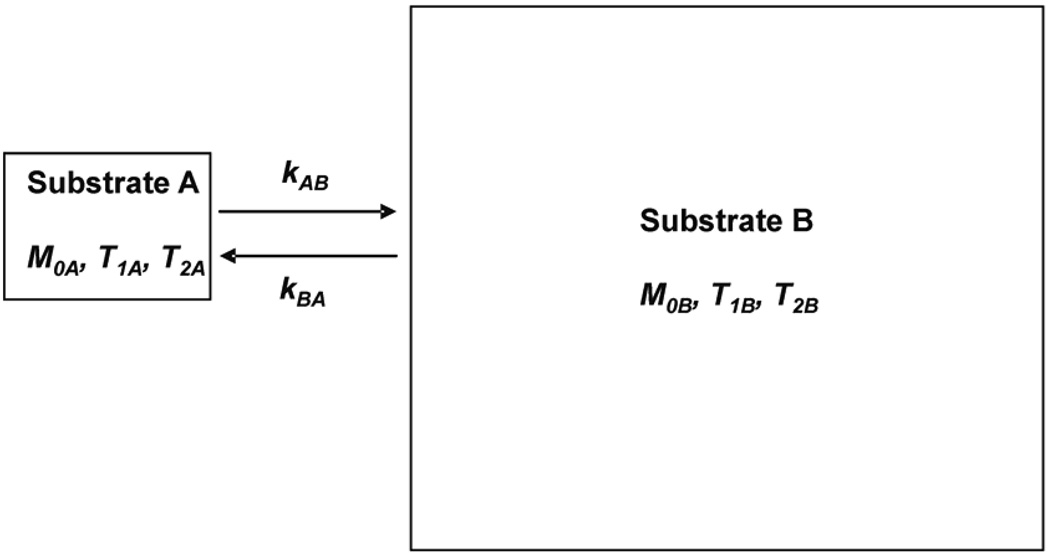
The two-site exchange model for substrate A ↔ substrate B. M0A and M0B represent the thermal equilibrium magnetization of substrate A and B, respectively. T1A, T1B and T2A, T2B represent the longitudinal, transverse relaxation time in the absence of exchange between substrate A and B. kAB and kBA are the pseudo-first-order rate constants of the unidirectional A → B and B → A fluxes, respectively.
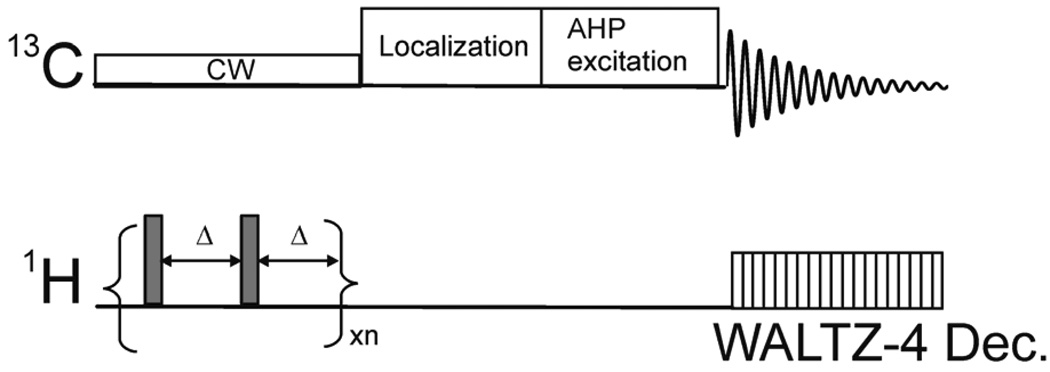
A surface coil pulse sequence for the 13C saturation transfer with 13C detection experiments. Broadband 1H→13C NOE is generated using a train of non-selective hard pulses with a nominal flip angle of 180° spaced at Δ= 100 ms apart. A simultaneous CW pulse or a train of spectrally selective Gaussian pulses is executed for radiofrequency saturation at substrate A resonance or at the control frequency during NOE generation. An adiabatic AHP and WALTZ-4 pulses were used for excitation and subsequent proton decoupling, respectively. Additional spatial localization may be added prior to 13C excitation.
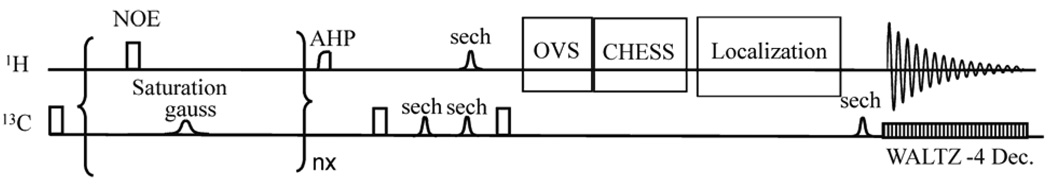
Pulse sequence for the 13C saturation transfer with 1H detection experiments (depiction of gradient pulses is omitted for clarity). Substrate A is irradiated using a continuous train of 2 ms nominally 180° Gaussian pulses and a simultaneous train of nominally 180° 200 µs rectangular pulses spaced 200 ms apart. At the end of the saturation pulse trains, an optional 500 µs AHP pulse and crusher gradients is used for further water suppression. A nonadiabatic 90° x pulse is then used for excitation of 13C equilibrium signals. A pair of identical hyperbolic secant pulses (sech, 2.5 ms, µ = 3, 1% truncation) are used to generate an adiabatic double spin echo with an 13C echo time (TE1) of 8.3 ms. A 1.5-ms sech pulse is also applied to the proton channel to reintroduce heteronuclear J evolution. A nonadiabatic 200 µs 90° ±y pulse is used to convert the antiphase terms into longitudinal two-spin orders. Then, proton outer volume suppression using six nominal 90° sech pulses (2 ms, µ = 5, 1% truncation) along the×(10 mm slab), −x (10 mm slab), y (3 mm slab), −y (5 mm slab), z (10 mm slab), −z (10 mm slab) directions plus crusher gradients, and CHESS water suppression (15 ms, Gaussian 90° pulse plus gradient crushers) are executed. Finally, the single-shot, fully adiabatic proton localization sequence is used to convert longitudinal two-spin orders into antiphase transverse proton coherence and to achieve transverse spatial localization for selection of a 5 (x) × 2.9 (y) × 5 (z) mm3 (72.5 µL) voxel. A hyperbolic secant pulse is applied to the 13C channel to refocus heteronuclear J evolution. After a nominal delay of 1/21JCH, the in-phase transferred proton coherence is detected with simultaneous 13C decoupling using WALTZ4. Reprinted from [28], with permission from Elsevier Inc.
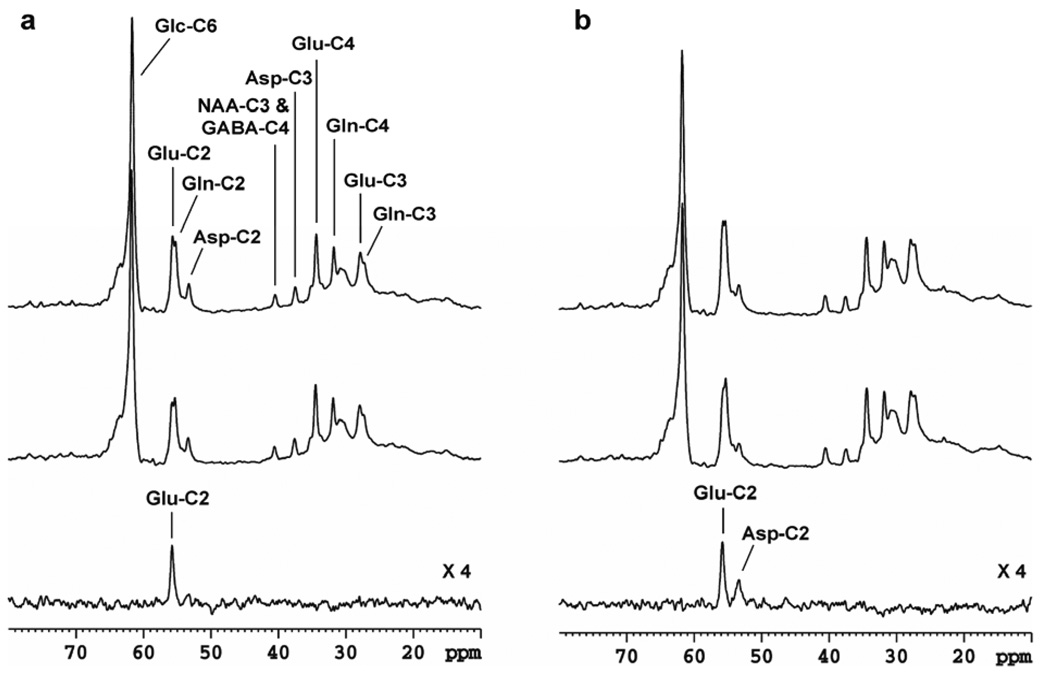
(a) Comparison of a 500 MHz 1H saturation transfer spectrum with the corresponding symmetric control spectrum for α-ketoglutarate ↔ glutamate. The relaxation delay was TR= 10 s. The strength of the saturation pulse was B1sat = 158 Hz. A line broadening of lb = 30 Hz was applied, and the total number of scans was NS = 512. (b) Comparison of saturation transfer spectrum with the corresponding symmetric control spectrum for oxaloacetate ↔ aspartate. TR= 10 s. B1sat = 790 Hz. LB = 30 Hz. Total NS = 512. Upper traces: control spectra; middle traces: saturation transfer spectra; lower traces: difference spectra. The saturation transfer spectra were acquired with CW saturation of carbonyl carbons of the keto acids. The control spectra were acquired with the saturation pulse placed at an equal distance from amino acid C2, but on the opposite site of its cognate keto acid C2. Asp: aspartate; GABA: γ-aminobutyric acid; Glc: glucose; Glu: glutamate; NAA: N-acetylaspartate. Fig.4a was reprinted from [76], with permission from John Wiley & Sons, Ltd.
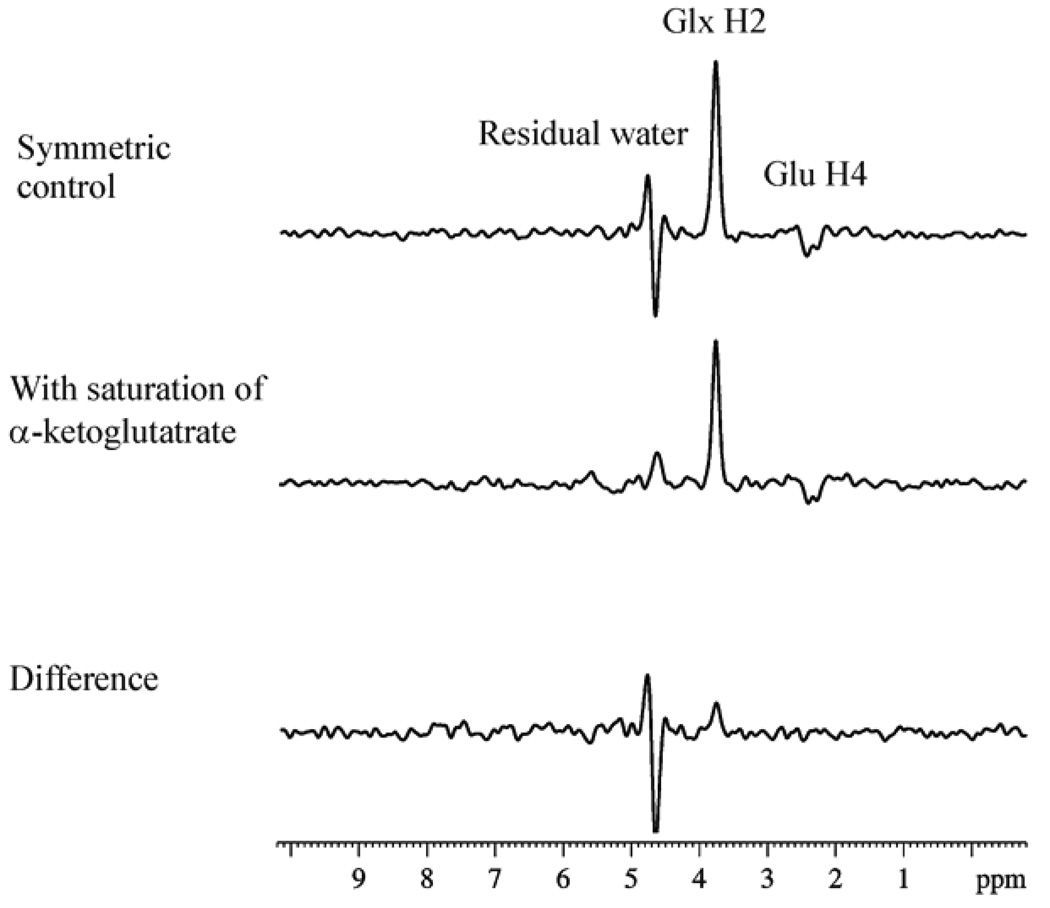
125 MHz 13C spectra from a [1,6-13C2]glucose infusion experiment showing the saturation transfer effect caused by rapid exchange between α-KG and Glu using 13C saturation transfer with 1H detection method. A 72.5 µl voxel was localized in the rat brain. The relaxation delay was TR = 7.1 s with a total number of scans of NS=512. A Lorentz-Gaussian apodisation was applied with lb = −20 Hz and gb = 0.02. In the upper and middle traces, resonances from Glx H2 (glutamate H2 + glutamine H2) (3.75–3.76 ppm), glutamate H4 (2.3–2.4 ppm), and residual water (4.65 ppm) were observed. The difference spectrum (bottom trace) shows the expected magnetization transfer effect at 3.75 ppm. Reprinted from [28], with permission from Elsevier Inc.
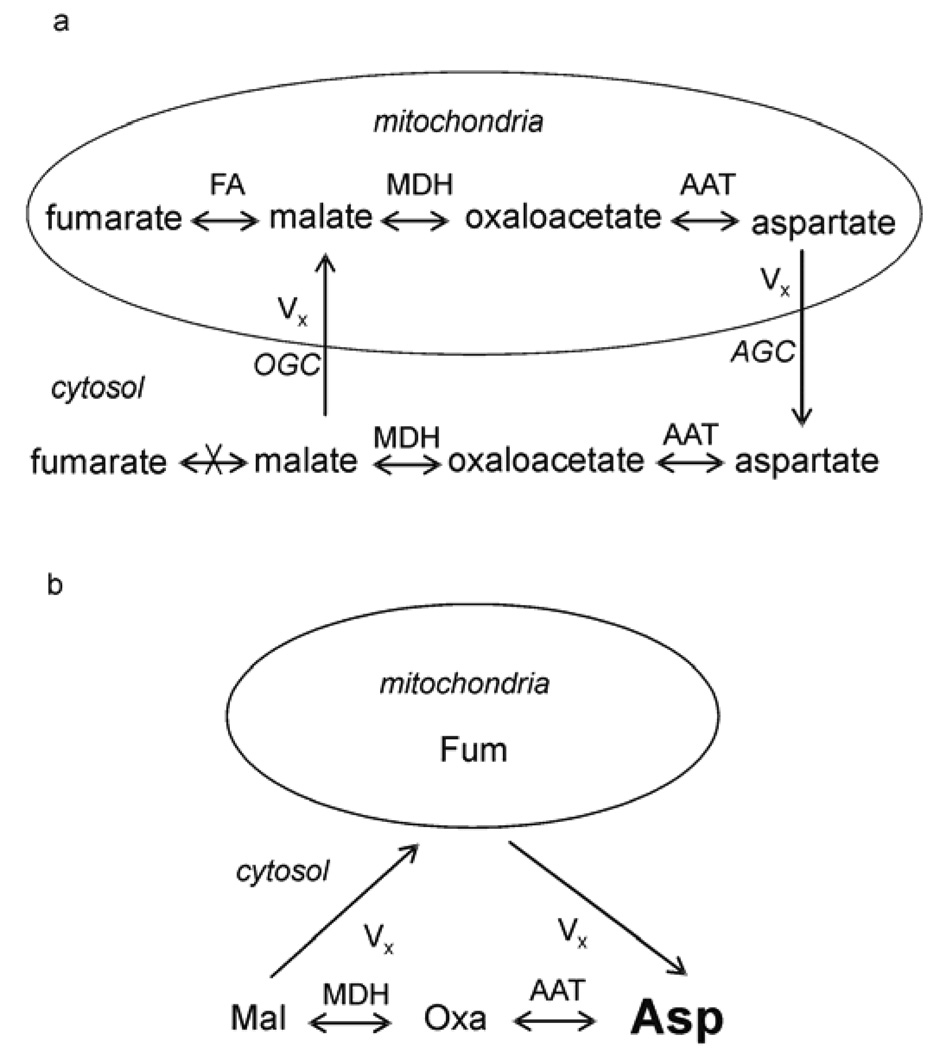
(a) The exchange of four-carbon molecules between cytosol and mitochondria (adapted from Fig. 46 [70]). Cytosolic malate enters mitochondria through the oxoglutarate carrier (OGC). Mitochondrial aspartate enters cytosol through the aspartate/glutamate carrier (AGC). The rapid exchange reactions between malate and oxaloacetate and between oxaloacetate and aspartate are catalyzed by malate dehydrogenase (MDH) and aspartate aminotransferase (AAT), respectively. In mitochondria, malate is also in rapid exchange with fumarate catalyzed by fumarase (FA). (b) Simplified four-site exchange model for estimating Vx using relayed 13C magnetization transfer spectroscopy and the Bloch–McConnell equations. The small mitochondrial fumarate, malate, oxaloacetate, and aspartate pools are lumped into one site denoted by fumarate. This simplification attributes loss of saturation inside the mitochondrial matrix to Vx. The Vx value calculated through this model therefore represents its lower limit. The large, bold font for cytosolic aspartate indicates that its pool size is overwhelmingly larger than all other pools in the diagram. Asp, cytosolic aspartate; Fum, mitochondrial fumarate; Mal, cytosolic malate; Oxa, cytosolic oxoloacetate. Reprinted from [29], with permission from Blackwell Publishing.
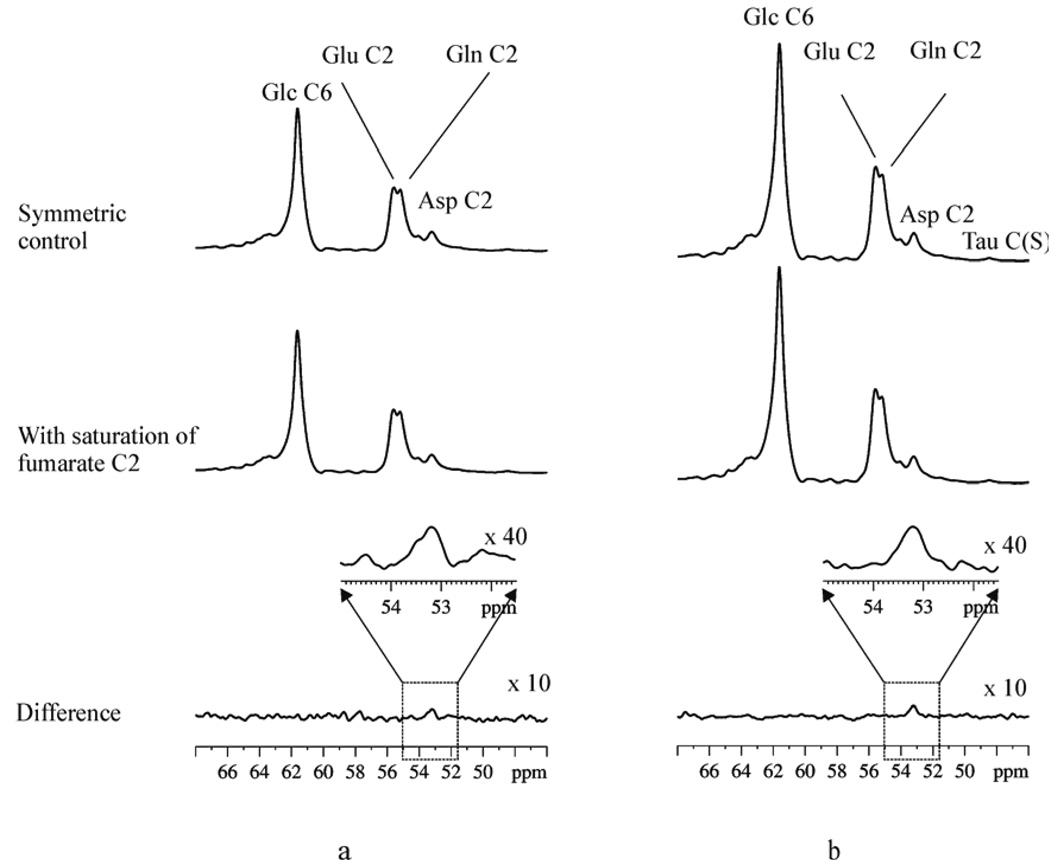
(a) In vivo relayed 125 MHz 13C magnetization transfer results from one rat. Top trace: control spectrum with the Gaussian saturation pulse train placed at −29.7 ppm (NS=1280); middle trace: fumarate-saturated spectrum with the Gaussian saturation pulse train placed at 136.1 ppm; bottom trace and inset: difference spectrum. (b) In vivo relayed 13C magnetization transfer results summed from eight rats. Top trace: control spectrum summed from eight rats; middle trace: fumarate-saturated spectrum summed from eight rats (NS=10,240); bottom trace and inset: difference spectrum summed from eight rats. Glc C6, α- and β-glucose C6; Glu C2, glutamate C2; Gln C2, glutamine C2; Asp C2, aspartate C2. Reprinted from [29], with permission from Blackwell Publishing.
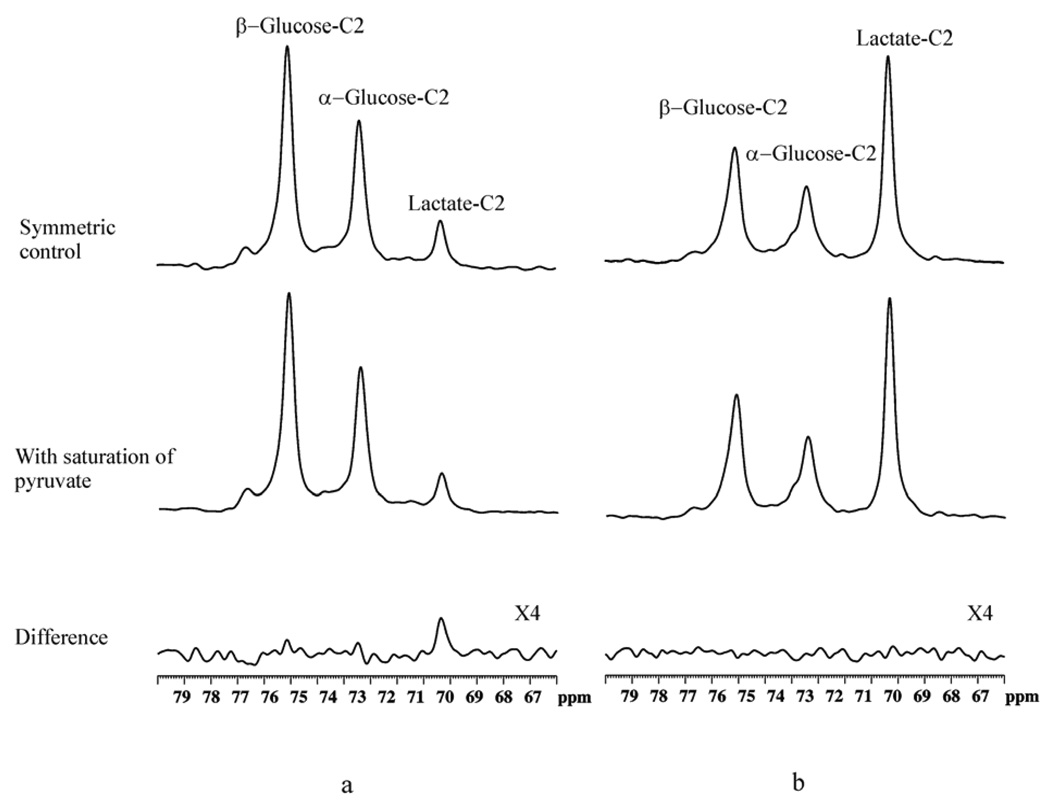
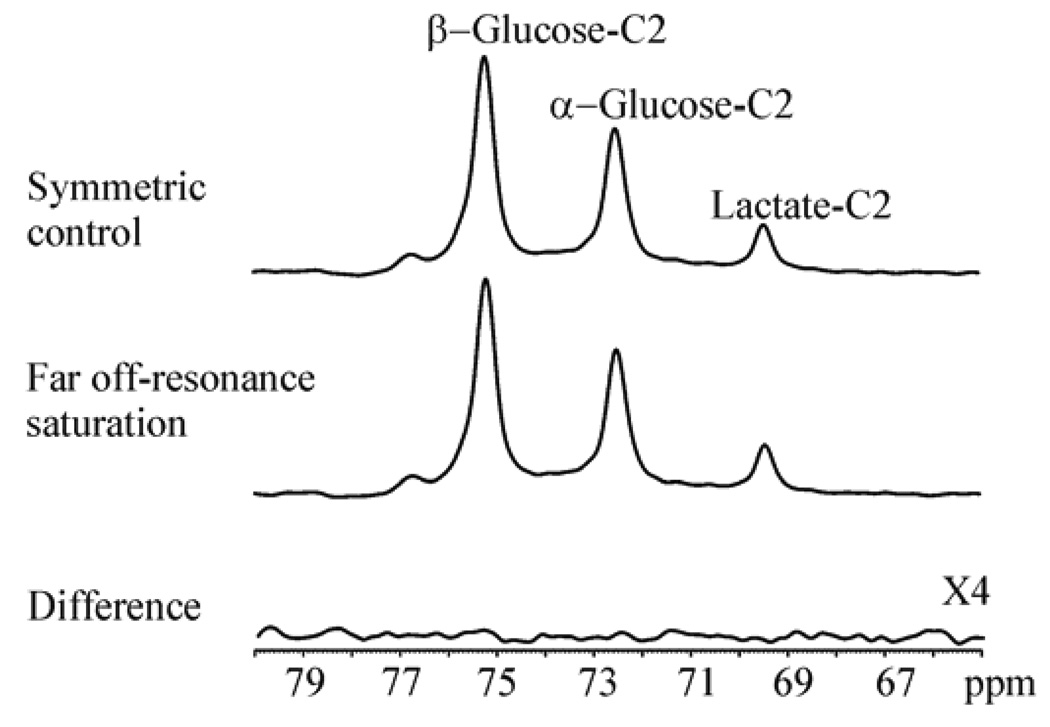
125 MHz 13C spectra from a [2-13C]glucose infusion experiment showing the saturation transfer effect caused by rapid exchange between pyruvate and lactate. A relaxation delay of TR = 9 s was used, and a total number of scans NS = 128 × 4 were acquired. A Gaussian window function was used with lb = −10 Hz, gb = 0.03. The saturating field used was γB1sat = 315 Hz. (a) Bicuculline-treated rat brain, (b) Postmortem. Top traces: symmetric control spectra. Middle traces: with saturation of pyruvate C2 at 207.9 ppm. Bottom trace: difference spectra. Spectra from each stack were summed from four rats. Reprinted from [25], with permission from John Wiley & Sons, Ltd.
Investigation of nonspecific off-resonance magnetization transfer effect. 125 MHz 13C Spectra acquired using the same parameters as in Fig. 8 except that the saturation pulse placed at the resonance frequency of pyruvate C2 was shifted by 75 kHz. A significant, nonspecific, off-resonance magnetization transfer effect, which could arise from exchange between a putative small pool of immobilized lactate and free lactate could not be detected. Spectra were summed from four rats. Reprinted from [25], with permission from John Wiley & Sons, Ltd.
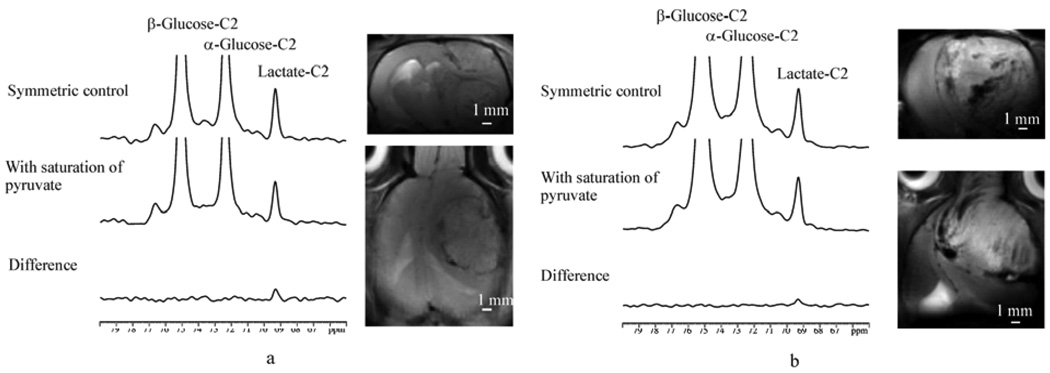
Examples of 125 MHz 13C saturation transfer effect observed in rat brain with C6 glioma. (a) From a rat after 16 days of inoculation. 13C MRS parameters: A relaxation delay of TR = 9 sec was used, and a total number of scans NS = 192 were acquired. A Gaussian window fuction was used with lb = −10 Hz. gb = 0.03. Anatomical imaging parameters: A relaxation delay of TR=3050 ms and an echo time of TE = 30 ms were used. The slice thickness used was st = 2 mm with a field of view FOV = 2.56 cm. The matrix size of the image was 128 × 128. The rat was infused with [2-13C]glucose. ΔMLac/M0Lac = 0.19. (b) From a second rat after 15 days of inoculation. ΔMLac/M0Lac = 0.10. All NMR parameters were the same as in (a). Reprinted from [25], with permission from John Wiley & Sons, Ltd.
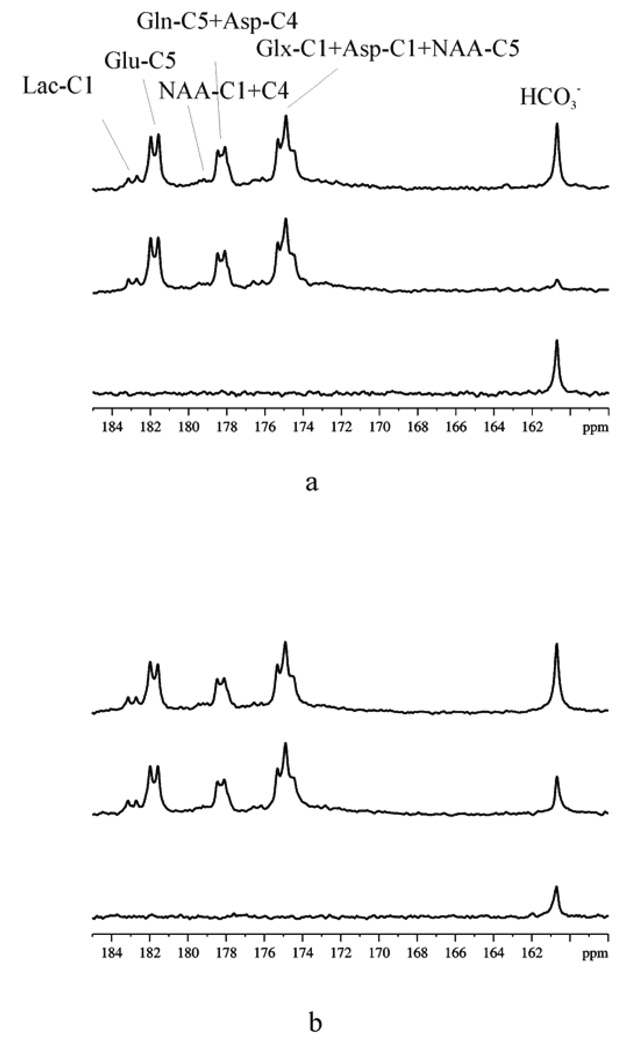
125 MHz 13C spectra from a [U-13C]glucose infusion experiment showing the saturation transfer effect due to rapid exchange between CO2 and HCO3− in rat brains. A relaxation delay of TR = 53 s was used, and a total number of scans NS = 256 were acquired. A line broadening of, lb = 15 Hz was applied. (a) Control; (b) acetazolamide-treated. Top traces: symmetric control spectra; Middle traces: with saturation of CO2 at 125.0 ppm. Bottom trace: difference spectra. Reprinted from [27], with permission from John Wiley & Sons, Ltd.
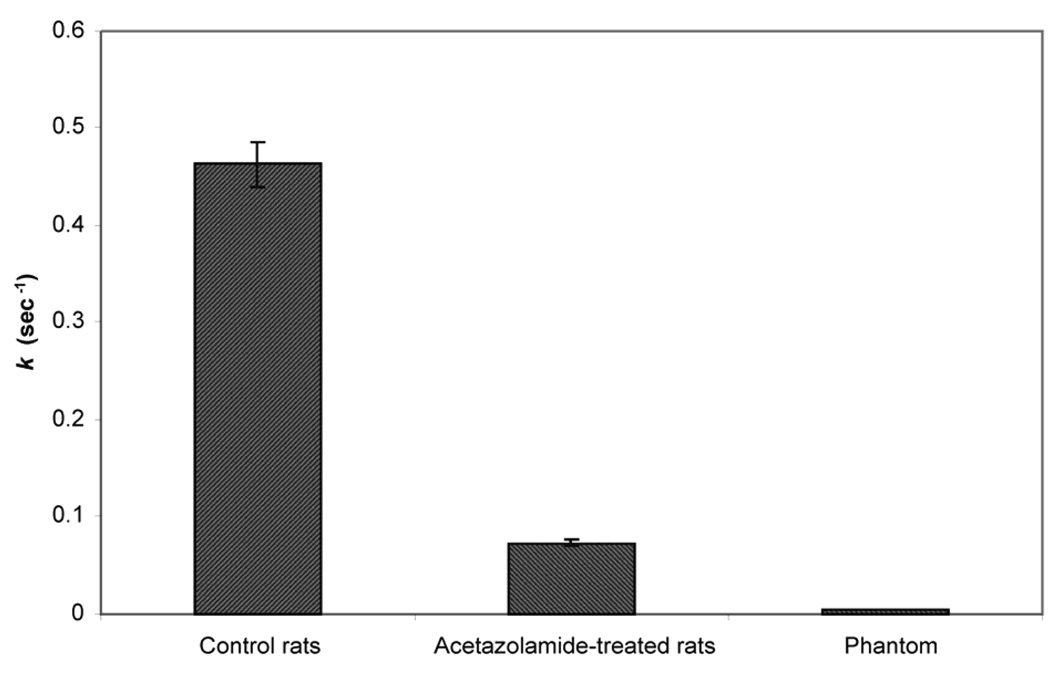
Pseudo first-order unidirectional dehydration rate constant determined from phantom, control rats, and rats treated with acetazolamide. Reprinted from [27], with permission from John Wiley & Sons, Ltd.
Similar articles
-
Use of in vivo magnetic resonance spectroscopy for studying metabolic diseases.Exp Mol Med. 2015 Feb 6;47(2):e139. doi: 10.1038/emm.2014.101. Exp Mol Med. 2015. PMID: 25656949 Free PMC article. Review.
-
Characterization of Brain Metabolism by Nuclear Magnetic Resonance.Chemphyschem. 2019 Jan 21;20(2):216-230. doi: 10.1002/cphc.201800917. Epub 2018 Dec 20. Chemphyschem. 2019. PMID: 30536696 Free PMC article. Review.
-
Current and future applications of in vitro magnetic resonance spectroscopy in hepatobiliary disease.World J Gastroenterol. 2006 Aug 14;12(30):4773-83. doi: 10.3748/wjg.v12.i30.4773. World J Gastroenterol. 2006. PMID: 16937457 Free PMC article.
-
A combined n.m.r. and molecular biological approach to studying enzymes in vivo.Biochem Soc Trans. 1991 Nov;19(4):997-1001. doi: 10.1042/bst0190997. Biochem Soc Trans. 1991. PMID: 1838991 Review. No abstract available.
-
Hyperpolarized 13C-labeled bicarbonate (H13CO3-) for in vivo pH measurement with 13C magnetic resonance spectroscopy.2010 Jan 25 [updated 2010 Apr 12]. In: Molecular Imaging and Contrast Agent Database (MICAD) [Internet]. Bethesda (MD): National Center for Biotechnology Information (US); 2004–2013. 2010 Jan 25 [updated 2010 Apr 12]. In: Molecular Imaging and Contrast Agent Database (MICAD) [Internet]. Bethesda (MD): National Center for Biotechnology Information (US); 2004–2013. PMID: 20641986 Free Books & Documents. Review.
Cited by
-
Interpretation of ³¹P NMR saturation transfer experiments: what you can't see might confuse you. Focus on "Standard magnetic resonance-based measurements of the Pi→ATP rate do not index the rate of oxidative phosphorylation in cardiac and skeletal muscles".Am J Physiol Cell Physiol. 2011 Jul;301(1):C12-5. doi: 10.1152/ajpcell.00100.2011. Epub 2011 Apr 13. Am J Physiol Cell Physiol. 2011. PMID: 21490314 Free PMC article. No abstract available.
-
In vivo detection of intermediate metabolic products of [1-(13) C]ethanol in the brain using (13) C MRS.NMR Biomed. 2011 Nov;24(9):1054-62. doi: 10.1002/nbm.1653. Epub 2011 Feb 11. NMR Biomed. 2011. PMID: 21312308 Free PMC article.
-
Early development of arterial spin labeling to measure regional brain blood flow by MRI.Neuroimage. 2012 Aug 15;62(2):602-7. doi: 10.1016/j.neuroimage.2012.01.005. Epub 2012 Jan 8. Neuroimage. 2012. PMID: 22245338 Free PMC article. Review.
References
Grants and funding
LinkOut - more resources
Full Text Sources
