

Stretch and Shear Interactions Affect Intercellular Junction Protein Expression and Turnover in Endothelial Cells
- PMID: 20161517
- PMCID: PMC2799298
- DOI: 10.1007/s12195-009-0073-7
Stretch and Shear Interactions Affect Intercellular Junction Protein Expression and Turnover in Endothelial Cells
Abstract
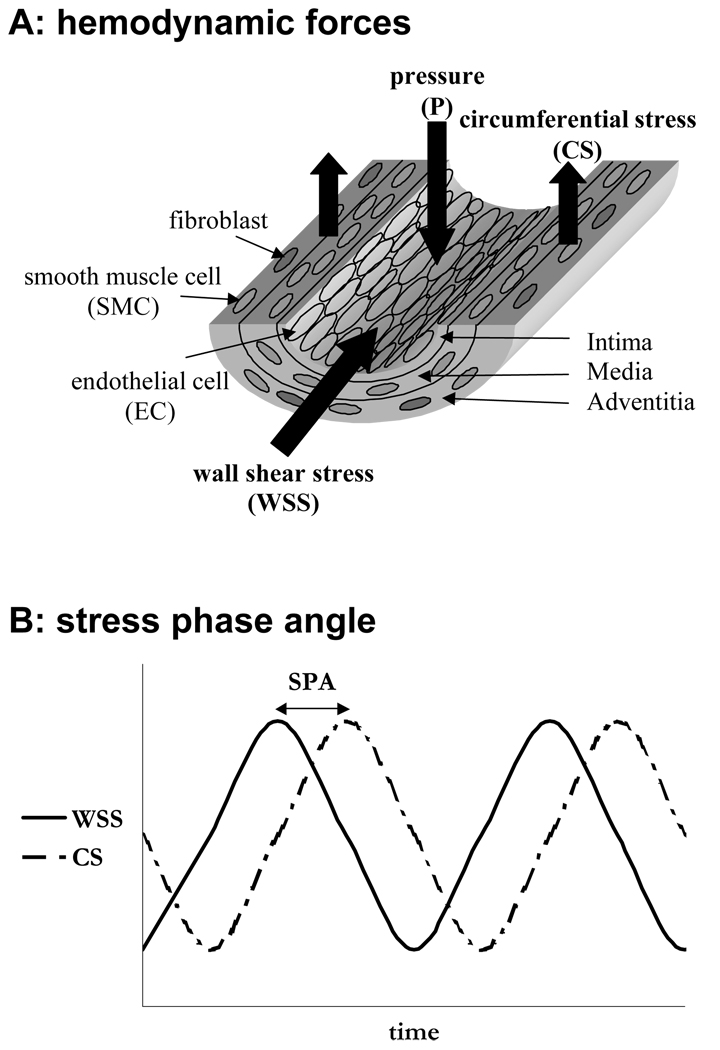
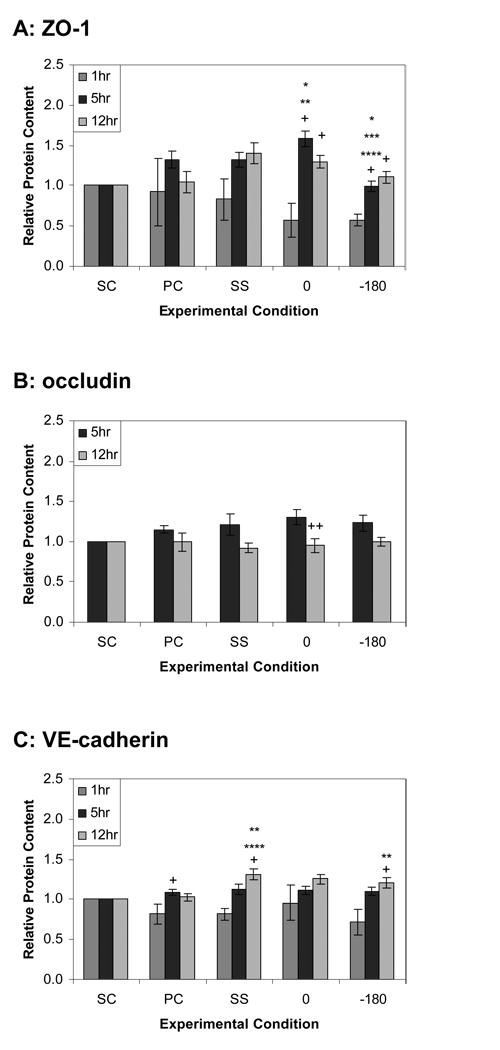
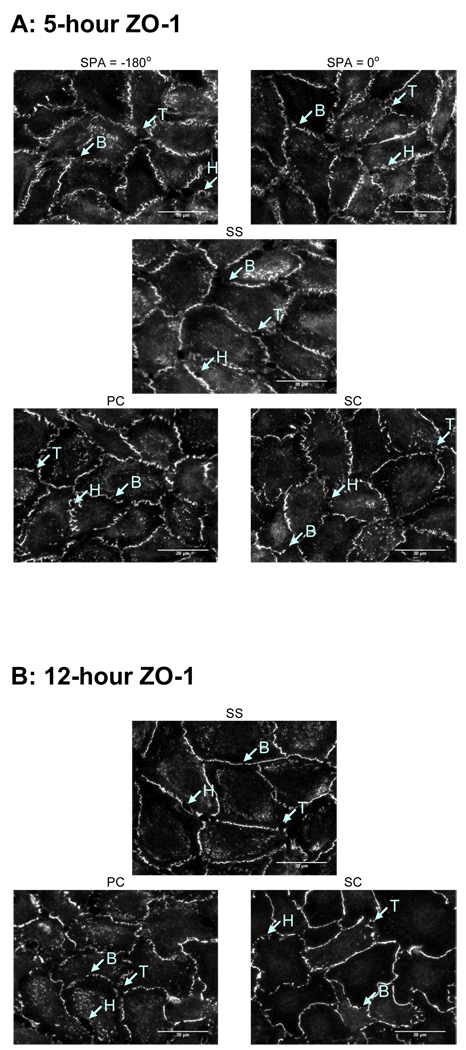
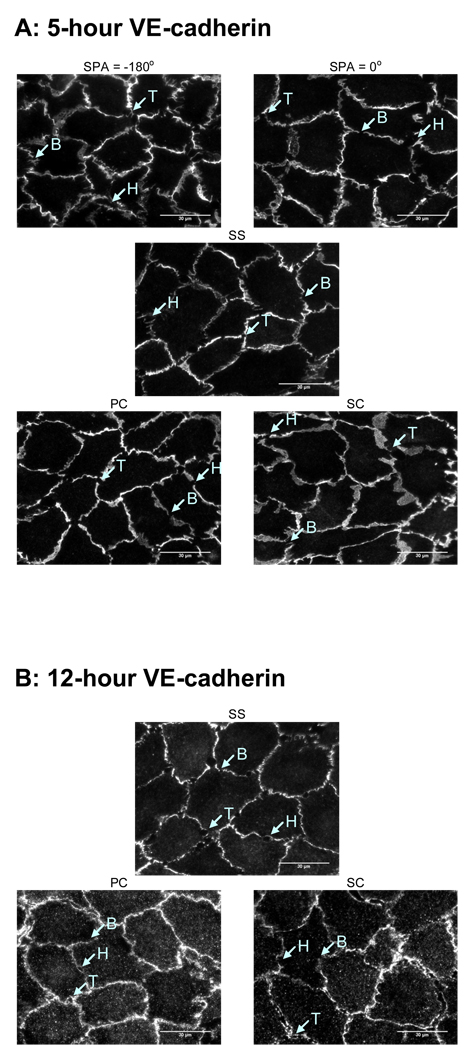
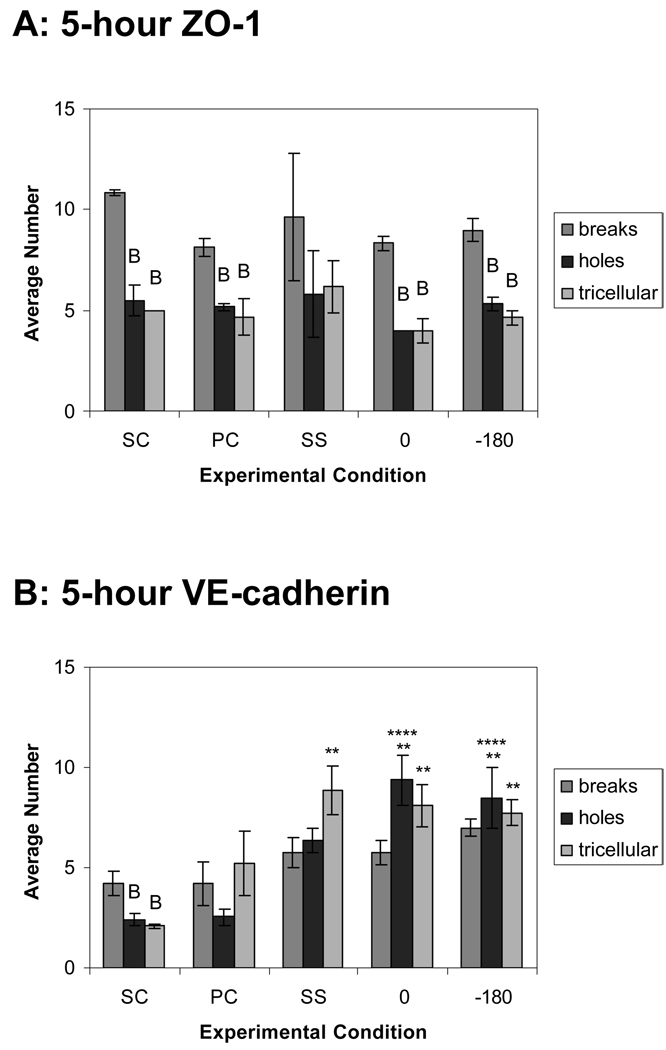
Complex hemodynamics play a role in the localization and development of atherosclerosis. Endothelial cells (ECs) lining blood vessel walls are directly influenced by various hemodynamic forces: simultaneous wall shear stress (WSS), normal stress, and circumferential stress/strain (CS) due to pulsatile flow, pressure, and diameter changes. ECs sense and transduce these forces into biomolecular responses that may affect intercellular junctions. In this study, a hemodynamic simulator was used to investigate the combined effects of WSS and CS on EC junctions with emphasis on the stress phase angle (SPA), the temporal phase difference between WSS and CS. Regions of the circulation with highly negative SPA, such as the coronary arteries and carotid bifurcation, are more susceptible to the development of atherosclerosis. At 5 h, expression of the tight junction protein zonula occludens-1 was significantly higher for the atheroprotective SPA = 0° compared to the atherogenic SPA = -180° while the apoptosis rate was significantly higher for SPA = -180° than SPA = 0°. This decrease in tight junction protein and increase in apoptosis and associated leaky junctions suggest a decreased junctional stability and a higher paracellular permeability for atherogenic macromolecules for the atherogenic SPA = -180° compared to SPA = 0°.
Figures

Similar articles
-
The Interaction between Fluid Wall Shear Stress and Solid Circumferential Strain Affects Endothelial Gene Expression.PLoS One. 2015 Jul 6;10(7):e0129952. doi: 10.1371/journal.pone.0129952. eCollection 2015. PLoS One. 2015. PMID: 26147292 Free PMC article.
-
Large Negative Stress Phase Angle (SPA) attenuates nitric oxide production in bovine aortic endothelial cells.J Biomech Eng. 2006 Jun;128(3):329-34. doi: 10.1115/1.1824120. J Biomech Eng. 2006. PMID: 16706582
-
Stress phase angle depicts differences in arterial stiffness: phantom and in vivo study.Phys Med Biol. 2015 Jun 7;60(11):4281-94. doi: 10.1088/0031-9155/60/11/4281. Epub 2015 May 14. Phys Med Biol. 2015. PMID: 25974091
-
Importance of hemodynamic forces as signals for exercise-induced changes in endothelial cell phenotype.J Appl Physiol (1985). 2008 Mar;104(3):588-600. doi: 10.1152/japplphysiol.01096.2007. Epub 2007 Dec 6. J Appl Physiol (1985). 2008. PMID: 18063803 Free PMC article. Review.
-
Junctions at the crossroads: the impact of mechanical cues on endothelial cell-cell junction conformations and vascular permeability.Am J Physiol Cell Physiol. 2024 Oct 1;327(4):C1073-C1086. doi: 10.1152/ajpcell.00605.2023. Epub 2024 Aug 12. Am J Physiol Cell Physiol. 2024. PMID: 39129490 Review.
Cited by
-
Vascular mechanotransduction.Physiol Rev. 2023 Apr 1;103(2):1247-1421. doi: 10.1152/physrev.00053.2021. Epub 2023 Jan 5. Physiol Rev. 2023. PMID: 36603156 Free PMC article. Review.
-
Overview of Crosstalk Between Multiple Factor of Transcytosis in Blood Brain Barrier.Front Neurosci. 2020 Jan 21;13:1436. doi: 10.3389/fnins.2019.01436. eCollection 2019. Front Neurosci. 2020. PMID: 32038141 Free PMC article. Review.
-
The Interaction between Fluid Wall Shear Stress and Solid Circumferential Strain Affects Endothelial Gene Expression.PLoS One. 2015 Jul 6;10(7):e0129952. doi: 10.1371/journal.pone.0129952. eCollection 2015. PLoS One. 2015. PMID: 26147292 Free PMC article.
-
Mechanical compression drives cancer cells toward invasive phenotype.Proc Natl Acad Sci U S A. 2012 Jan 17;109(3):911-6. doi: 10.1073/pnas.1118910109. Epub 2011 Dec 27. Proc Natl Acad Sci U S A. 2012. PMID: 22203958 Free PMC article.
-
Flow shear stress regulates endothelial barrier function and expression of angiogenic factors in a 3D microfluidic tumor vascular model.Cell Adh Migr. 2014;8(5):517-24. doi: 10.4161/19336918.2014.970001. Cell Adh Migr. 2014. PMID: 25482628 Free PMC article.
References
-
- Antonetti DA, Wolpert EB, DeMaio L, Harhaj NS, Scaduto RC., Jr Hydrocortisone decreases retinal endothelial cell water and solute flux coincident with increased content and decreased phosphorylation of occludin. J Neurochem. 2002;80(4):667–677. - PubMed
-
- Berardi DE. Effects of Simultaneous Wall Shear Stress and Circumferential Strain on Endothelial Cell Junctions. Pennsylvania State University, Department of Bioengineering, University Park, Doctor of Philosophy. 2009:125.
-
- Burns AR, Walker DC, Brown ES, Thurmon LT, Bowden RA, Keese CR, Simon SI, Entman ML, Smith CW. Neutrophil transendothelial migration is independent of tight junctions and occurs preferentially at tricellular corners. J Immunol. 1997;159(6):2893–2903. - PubMed
-
- Cancel L, Tarbell J. The Role of Apoptosis and Mitosis in LDL Transport through Endothelial Cell Monolayers; BMES Annual Fall Meeting; St. Louis, MO. 2008.
-
- Cancel LM, Fitting A, Tarbell JM. In vitro study of LDL transport under pressurized (convective) conditions. Am J Physiol Heart Circ Physiol. 2007;293(1):H126–H132. - PubMed
Grants and funding
LinkOut - more resources
Full Text Sources
Research Materials
