

Utilizing transmembrane convection to enhance solute sampling and delivery by microdialysis: theory and in vitro validation
- PMID: 20161534
- PMCID: PMC2802079
- DOI: 10.1016/j.memsci.2009.10.050
Utilizing transmembrane convection to enhance solute sampling and delivery by microdialysis: theory and in vitro validation
Abstract
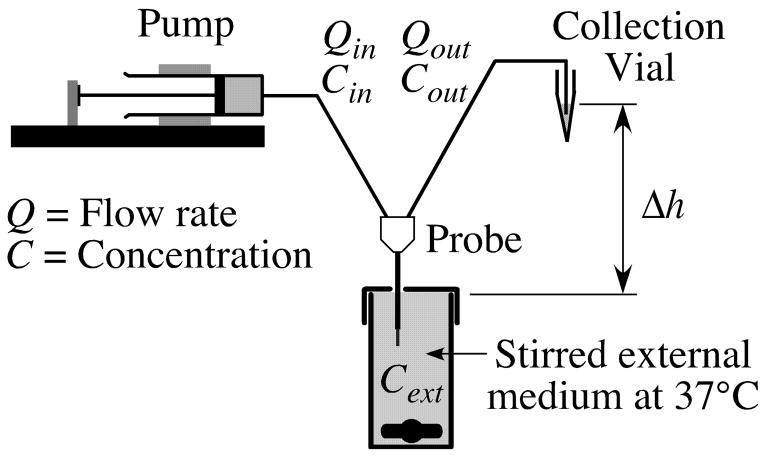
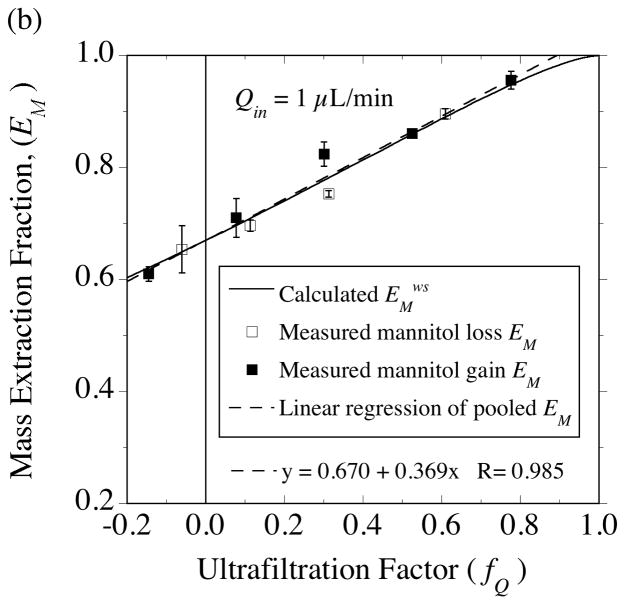
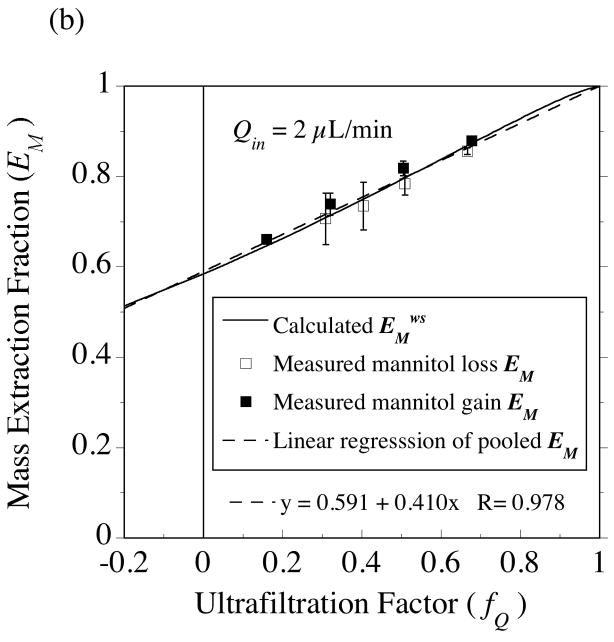
Microdialysis is a well-developed membrane-based tool relying on diffusion to sample diffusible constituents of complex media, such as biological tissue. The objective of this research is to expand the utility of microdialysis by combining transmembrane convection with diffusion to enhance solute exchange between microdialysis probes and the surrounding medium. We have developed a mathematical model to describe probe performance and performed validation experiments utilizing tracer solutes and commercially available probes with 100-kDa molecular weight cutoff membranes. Diffusive and fluid permeabilities of the probe membranes are evaluated for probes immersed in well-stirred bathing media in vitro. Transmembrane convection alters the solute extraction fraction, i.e., the fractional loss of a solute from the probe perfusate during delivery and the fractional gain by the perfusate during sampling. The extraction fraction change depends upon the magnitude and direction (inward or outward) of fluid movement across the membrane. However, for solutes with zero reflection coefficients, equality is maintained between these delivery and sampling extraction fractions. This equality is a prerequisite for probe calibration approaches that rely on analyte delivery from the perfusate. Thus, we have provided the theoretical and experimental basis for exploiting convection in a quantitative manner to enhance solute delivery and sampling in microdialysis applications.
Figures
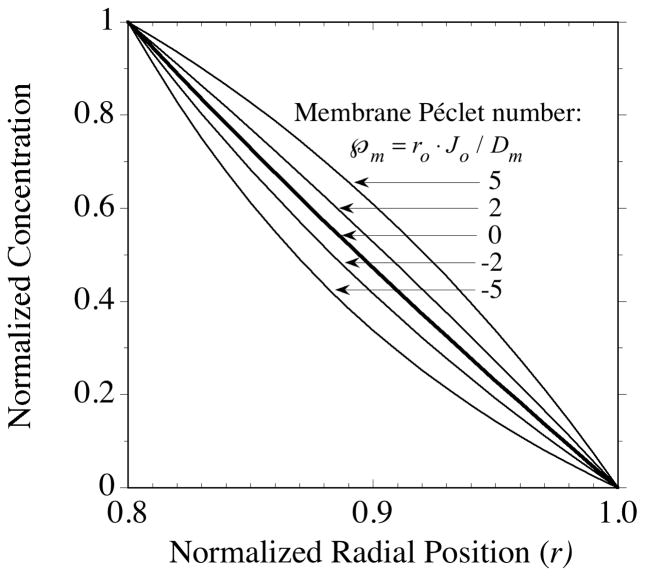
 , indicates the magnitude of convection relative to diffusion within the membrane. The profile in the absence of convection is indicated by the single thicker curve labeled, = 0. The Péclet number is positive for flow in the outward direction and negative for inwardly directed flow.
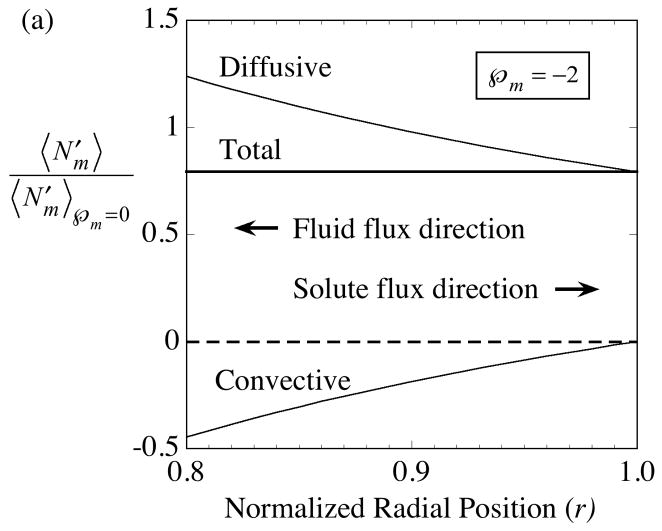 = −2, or (b) outward as indicated by the positive membrane Péclet number, = +2. The membrane fluid phase axial-average concentration at the outside surface is maintained at
.
= −2, or (b) outward as indicated by the positive membrane Péclet number, = +2. The membrane fluid phase axial-average concentration at the outside surface is maintained at
.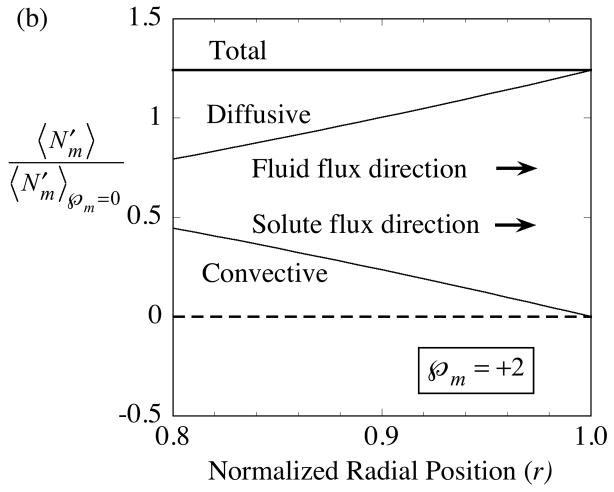 = −2, or (b) outward as indicated by the positive membrane Péclet number, = +2. The membrane fluid phase axial-average concentration at the outside surface is maintained at
.
= −2, or (b) outward as indicated by the positive membrane Péclet number, = +2. The membrane fluid phase axial-average concentration at the outside surface is maintained at
.
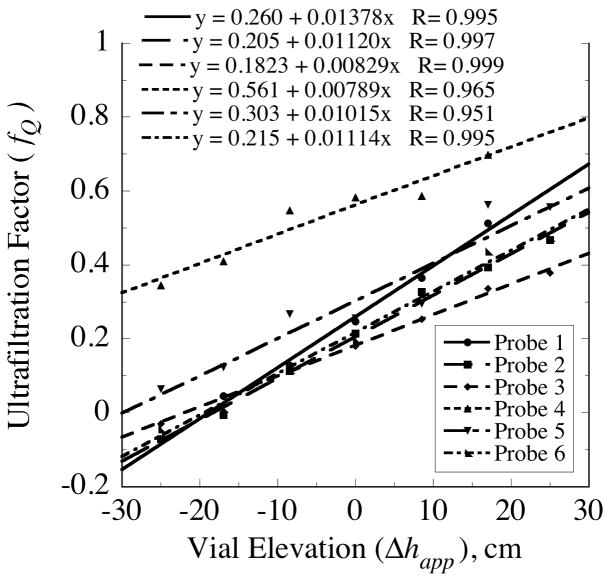
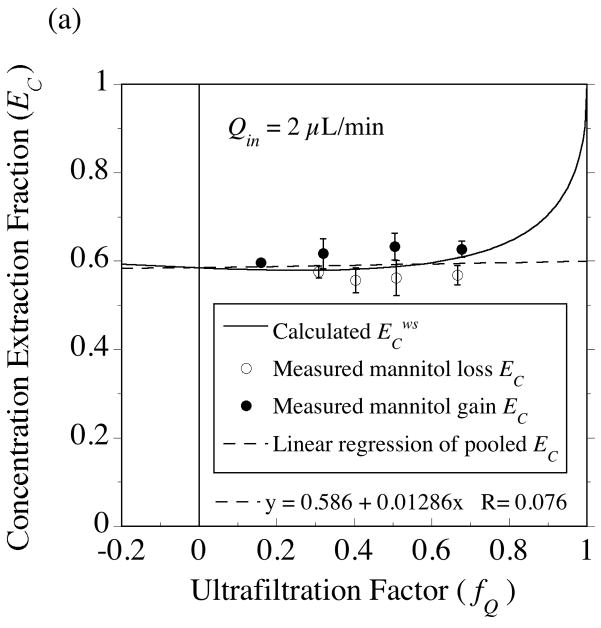
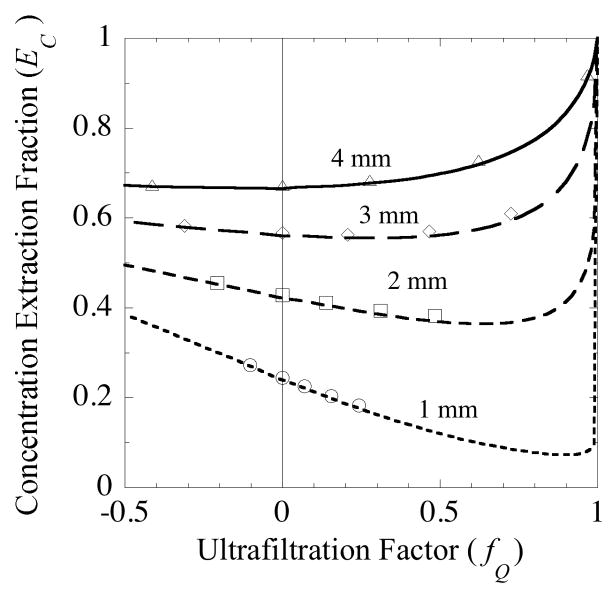
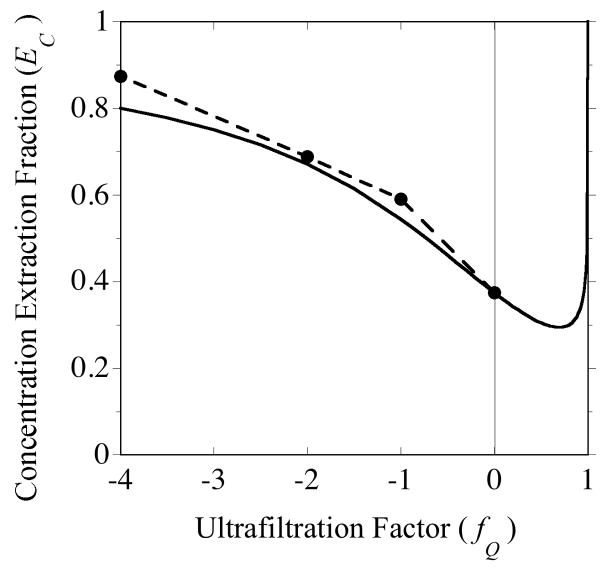
 , from Eq. (32) for a well-stirred external medium (Pext = 0).
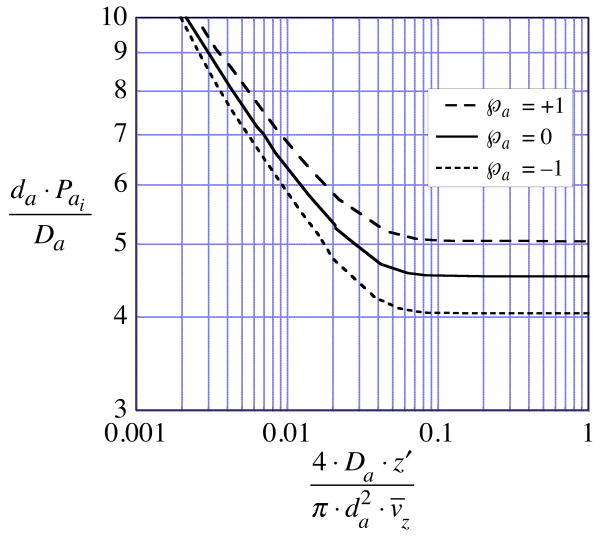
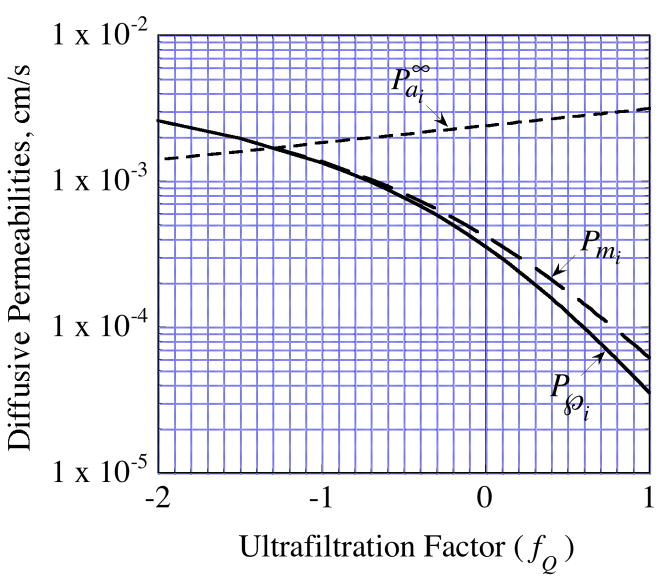
 = da·Ji/Da, in which Ji is the fluid flux across the interface at r = ri. The solid curve represents no convective flux across the interface ( = 0), the dotted curve illustrates that inward convection ( = −1) reduces the permeability and the dashed curve illustrates that outward convection ( = +1) increases the permeability.
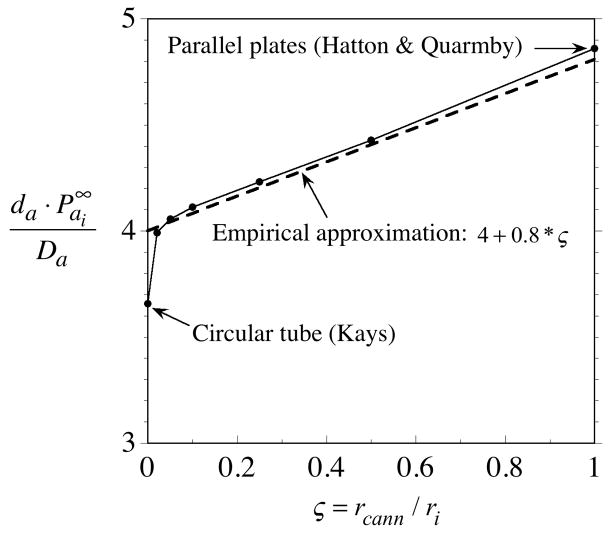 = 0 curve from Fig. A1 corresponds to the value on this plot at ς = 0.61.
Similar articles
-
Urea as a recovery marker for quantitative assessment of tumor interstitial solutes with microdialysis.Cancer Res. 2001 Nov 1;61(21):7964-70. Cancer Res. 2001. PMID: 11691820
-
Automated microdialysis-based system for in situ microsampling and investigation of lead bioavailability in terrestrial environments under physiologically based extraction conditions.Environ Sci Technol. 2013 Oct 15;47(20):11668-75. doi: 10.1021/es401872j. Epub 2013 Sep 27. Environ Sci Technol. 2013. PMID: 24016003
-
Convection and diffusion in charged hydrated soft tissues: a mixture theory approach.Biomech Model Mechanobiol. 2007 Jan;6(1-2):63-72. doi: 10.1007/s10237-006-0040-3. Epub 2006 Jun 10. Biomech Model Mechanobiol. 2007. PMID: 16767452 Free PMC article.
-
A model for transport of glucose in adipose tissue to a microdialysis probe.Diabetes Technol Ther. 2003;5(4):589-98. doi: 10.1089/152091503322250604. Diabetes Technol Ther. 2003. PMID: 14511413 Review.
-
A review of experimental measurements of effective diffusive permeabilities and effective diffusion coefficients in biofilms.Biotechnol Bioeng. 1998 Aug 5;59(3):261-72. doi: 10.1002/(sici)1097-0290(19980805)59:3<261::aid-bit1>3.0.co;2-9. Biotechnol Bioeng. 1998. PMID: 10099336 Review.
Cited by
-
In vivo monitoring of serotonin in the striatum of freely moving rats with one minute temporal resolution by online microdialysis-capillary high-performance liquid chromatography at elevated temperature and pressure.Anal Chem. 2013 Oct 15;85(20):9889-97. doi: 10.1021/ac4023605. Epub 2013 Sep 24. Anal Chem. 2013. PMID: 24020786 Free PMC article.
-
A Review on Microdialysis Calibration Methods: the Theory and Current Related Efforts.Mol Neurobiol. 2017 Jul;54(5):3506-3527. doi: 10.1007/s12035-016-9929-8. Epub 2016 May 17. Mol Neurobiol. 2017. PMID: 27189617 Review.
-
Negligible In Vitro Recovery of Macromolecules from Microdialysis Using 100 kDa Probes and Dextran in Perfusion Fluid.Neurochem Res. 2024 May;49(5):1322-1330. doi: 10.1007/s11064-024-04119-7. Epub 2024 Mar 13. Neurochem Res. 2024. PMID: 38478218 Free PMC article.
-
Microdialysis as an Important Technique in Systems Pharmacology-a Historical and Methodological Review.AAPS J. 2017 Sep;19(5):1294-1303. doi: 10.1208/s12248-017-0108-2. Epub 2017 Jul 31. AAPS J. 2017. PMID: 28762127 Review.
-
Unifying the mathematical modeling of in vivo and in vitro microdialysis.J Pharm Biomed Anal. 2011 Apr 28;55(1):54-63. doi: 10.1016/j.jpba.2011.01.005. Epub 2011 Jan 19. J Pharm Biomed Anal. 2011. PMID: 21310575 Free PMC article.
References
-
- Rosdahl H, Ungerstedt U, Henriksson J. Microdialysis in human skeletal muscle and adipose tissue at low flow rates is possible if dextran-70 is added to prevent loss of perfusion fluid. Acta Physiol Scand. 1997;159:261–262. - PubMed
-
- Hamrin K, Rosdahl H, Ungerstedt U, Henriksson J. Microdialysis in human skeletal muscle: effects of adding a colloid to the perfusate. J Appl Physiol. 2002;92:385–393. - PubMed
-
- Trickler W, Miller DW. Use of osmotic agents in microdialysis studies to improve the recovery of macromolecules. J Pharm Sci. 2003;92:1419–1427. - PubMed
-
- Asai S, Kohno T, Ishii Y, Ishikawa K. A newly developed procedure for monitoring of extracellular proteins using a push-pull microdialysis. Anal Biochem. 1996;237:182–187. - PubMed
-
- Sjögren S, Svensson C, Anderson C. Technical prerequisites for in vivo microdialysis determination of interleukin-6 in human dermis. Br J Dermatol. 2002;146:375–382. - PubMed
Grants and funding
LinkOut - more resources
Full Text Sources
Other Literature Sources
Research Materials