. 2009 Nov 18;1(7):7ra16.
doi: 10.1126/scitranslmed.3000193.

Frequent release of low amounts of herpes simplex virus from neurons: results of a mathematical model

Affiliations

Frequent release of low amounts of herpes simplex virus from neurons: results of a mathematical model

Joshua T Schiffer et al. Sci Transl Med. .

Abstract

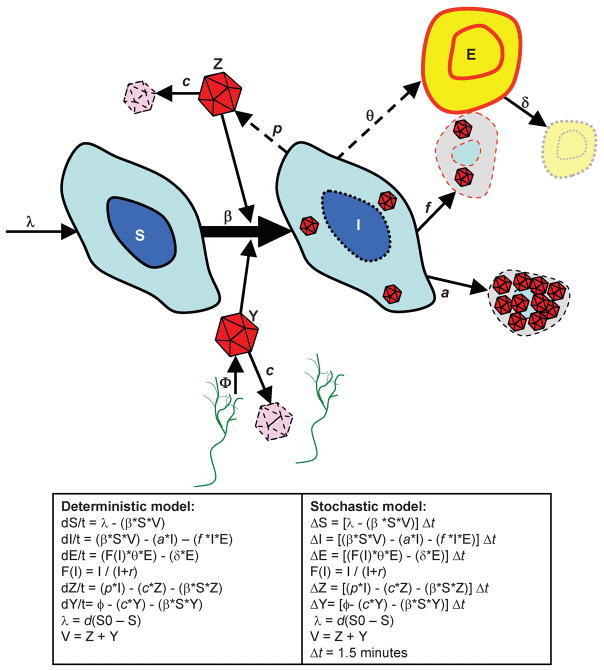
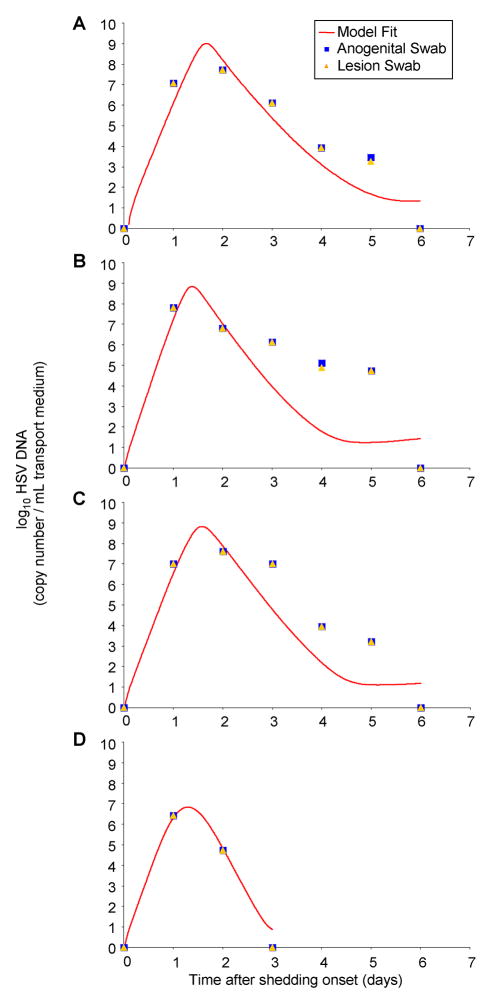
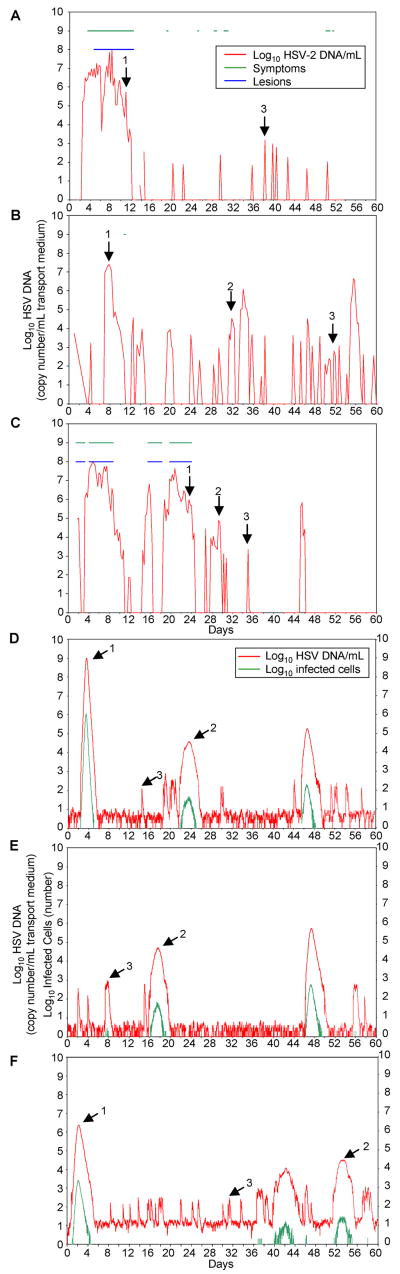
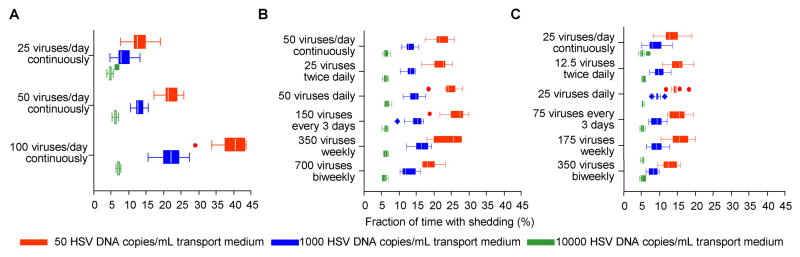
Herpes simplex virus-2 (HSV-2) is a sexually transmitted infection that is the leading cause of genital ulcers worldwide. Infection is life long and is characterized by repeated asymptomatic and symptomatic shedding episodes of virus that are initiated when virus is released from neurons into the genital tract. The pattern of HSV-2 release from neurons into the genital tract is poorly understood. We fit a mathematical model of HSV-2 pathogenesis to curves generated from daily quantification of HSV in mucosal swabs performed from patients with herpetic genital ulcers. We used virologic parameters derived from model fitting for stochastic model simulations. These simulations reproduced previously documented estimates for shedding frequency, and herpetic lesion diameter and frequency. The most realistic model output occurred when we assumed minimal amounts of daily neuronal virus introduction. In our simulations, small changes in average total quantity of HSV-2 released from neurons influenced detectable shedding frequency, while changes in frequency of neuronal HSV-2 release had little effect. Frequent HSV-2 shedding episodes in humans are explained by nearly constant release of small numbers of viruses from neurons that terminate in the genital tract.


Conflict of interest statement

Competing interests: The authors declare that they have no competing financial interests.

Figures

Figure 1
Figure 1
Cartoon diagram of model. S = Susceptible epithelial cells; I = Infected epithelial cells; E = CD8+ lymphocyte cells; Z = Viral particles from infected epithelial cells; Y = Viral particles from the neuronal bed. Green = sensory neurons.
Figure 2
Figure 2. The deterministic form of the model achieves good fit with empiric data from lesional swabs
Four examples of deterministic model curve fitting to mucosal HSV-2 shedding curves with daily serial quantitative PCRs performed on anogenital lesions. Actual patient quantitative HSV PCR data from anogenital swabs (blue circles) and lesional swabs (orange triangles) performed during herpetic lesions, and deterministic model fits (red lines).
Figure 3
Figure 3. In a stochastic form, the model generates shedding patterns that resemble those from actual patients
(A, B, C) Actual patient HSV-2 shedding patterns over 60 days (x axis) with anogenital swabs performed every 6 hours. Red line, log-10 HSV-2 DNA/mL transport medium. Green line, symptoms present. Blue line, lesion present. Arrow 1, high-copy episode. Arrow 2, medium copy episode. Arrow 3, low-copy episode. (A) There is 1 high-copy episode, no medium-copy episodes, 11 low-copy episodes episode, and 22.0% detectable shedding. (B) There are 3 high-copy episodes, 3 medium-copy episodes, 21 low-copy episodes, and 34.8% detectable shedding. (C) There are 3 high-copy episodes, 4 medium-copy episodes, 4 low-copy episodes and 39.3% detectable shedding. (D, E, F) Variations in the number of HSV particles introduced by neurons per day (φ) directly affect frequency of shedding and number of reactivations. Sixty-day stochastic model simulations using mean model-derived parameters from Table 1. Red line, log-10 HSV-2 DNA/mL transport medium. Green line, log-10 infected cells. Arrow 1, high-copy episode. Arrow 2, medium copy episode. Arrow 3, low-copy episode. (D) Neuronal release rate is 50 HSV-2 copies per day per 2-centimeter model area. There is 1 high-copy episode, 2 medium-copy episodes, 13 low-copy episodes, and 22.9% detectable shedding. (E) Neuronal release rate is 25 copies per day per 2-centimeter model area. There is 1 high-copy episode, 1 medium-copy episodes, 6 low-copy episodes and 16.9% detectable shedding. (F) Neuronal release rate is 100 copies per day per 2-centimeter model area. There is 1 high-copy episode, 2 medium-copy episodes, 22 low-copy episodes and 36.9% detectable shedding.
Figure 4
Figure 4. Determination of the detectable shedding of HSV-2 in the genital tract by average amount of HSV-2 introduced from sensory neurons into the genital tract per day
The pattern of reactivation from the sensory neurons has minimal effect on detectable HSV-2 shedding frequency provided that the average amount of HSV-2 per day is unchanged. (A) Simulations of constant HSV-2 introduction at rates of 25, 50 and 100 copies per day per 2-centimeter diameter area (~ 1, 2 and 4 copies HSV per hour) with percent of time with detectable shedding > 50 copies, > 1000 copies and > 10000 copies HSV/mL medium as outcomes. (B) Simulations of introduction of HSV-2 into the genital tract at an average rate of 50 copies per day per 2-centimeter diameter area with different patterns of viral introduction (constant versus bolus introductions twice daily, daily, every three days, weekly or bi-weekly). (C) Simulations of introduction of HSV-2 into the genital tract at an average rate of 25 copies per day per 2-centimeter diameter area with different patterns of viral introduction (constant versus bolus introductions twice daily, daily, every three days, weekly or bi-weekly). For each example, we performed ten simulations for each set of parameters to provide a range of shedding frequency. Boxes represent intra-quartile range (IQR). Whiskers represent the furthest data point, or 1.5*IQR below or above the quartile, whichever is closer. Dots represent data points more than 1.5*IQR above or 1.5*IQR below the quartile.

Similar articles

Cited by

References

    1. Weiss H. Epidemiology of herpes simplex virus type 2 infection in the developing world. Herpes. 2004;11(Suppl 1):24A. - PubMed
    1. Freeman E, et al. Herpes simplex virus 2 infection increases HIV acquisition in men and women: systematic review and meta-analysis of longitudinal studies. AIDS. 2006;20:73. - PubMed
    1. Gray R, et al. Probability of HIV-1 transmission per coital act in monogamous, heterosexual, HIV-1-discordant couples in Rakai, Uganda. Lancet. 2001;357:1149. - PubMed
    1. Stanberry LR, Kern ER, Richards JT, Abbott TM, Overall JC., Jr Genital herpes in guinea pigs: pathogenesis of the primary infection and description of recurrent disease. J Infect Dis. 1982;146:397. - PubMed
    1. Rattray MC, Corey L, Reeves WC, Vontver LA, Holmes KK. Recurrent genital herpes among women: symptomatic v. asymptomatic viral shedding. Br J Vener Dis. 1978;54:262. - PMC - PubMed

Publication types

LinkOut - more resources