. 2009 Nov 4;1(5):5ra12.
doi: 10.1126/scitranslmed.3000208.

Tetracyclines that promote SMN2 exon 7 splicing as therapeutics for spinal muscular atrophy

Affiliations

Tetracyclines that promote SMN2 exon 7 splicing as therapeutics for spinal muscular atrophy

Michelle L Hastings et al. Sci Transl Med. .

Abstract

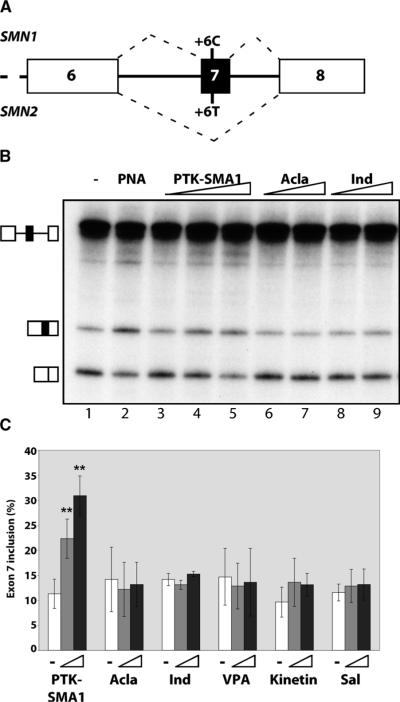
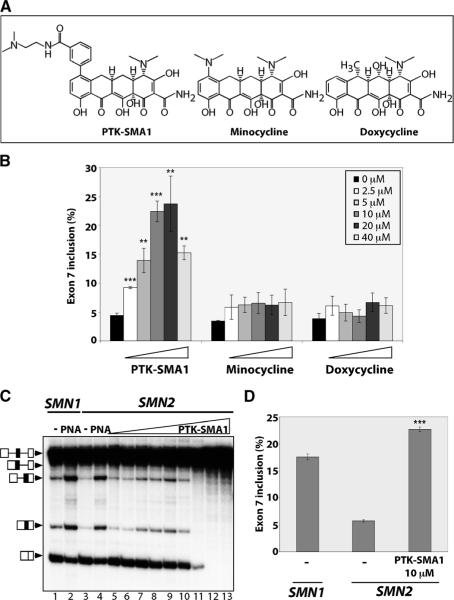
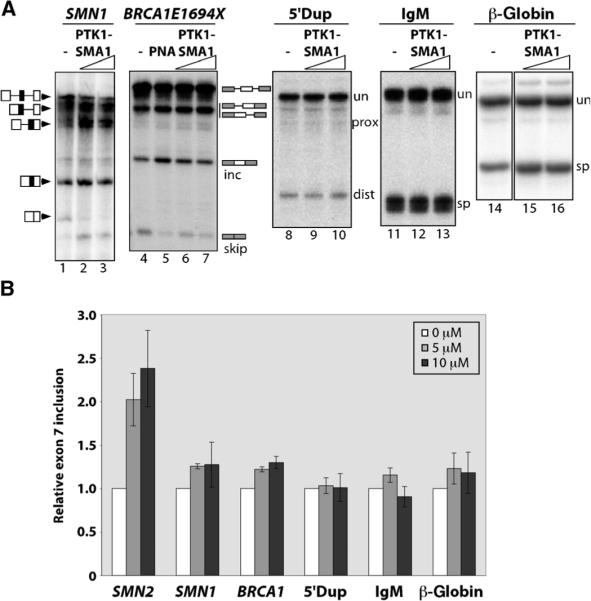
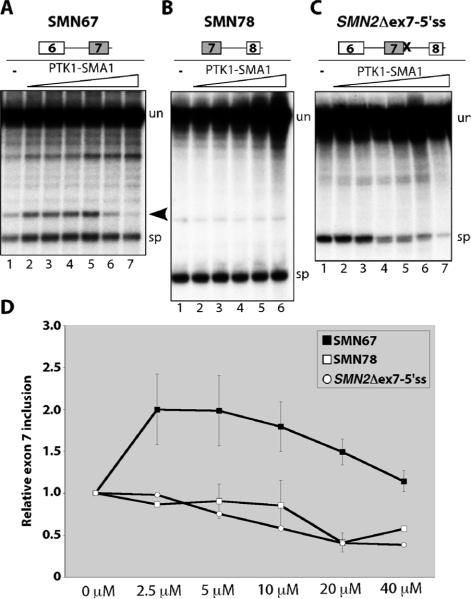
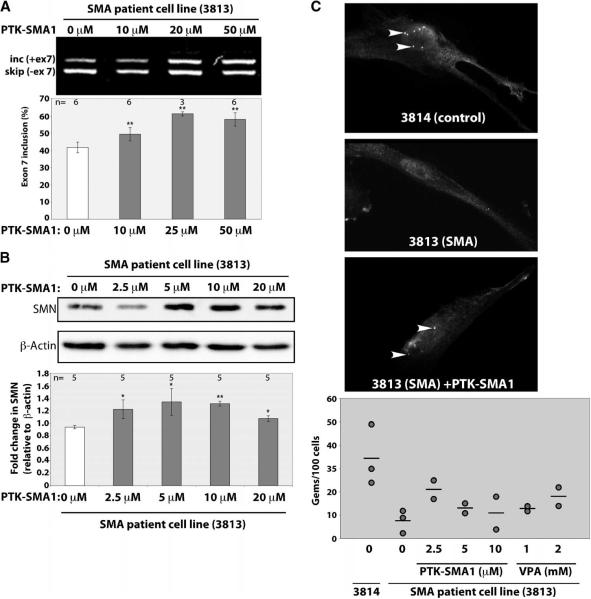
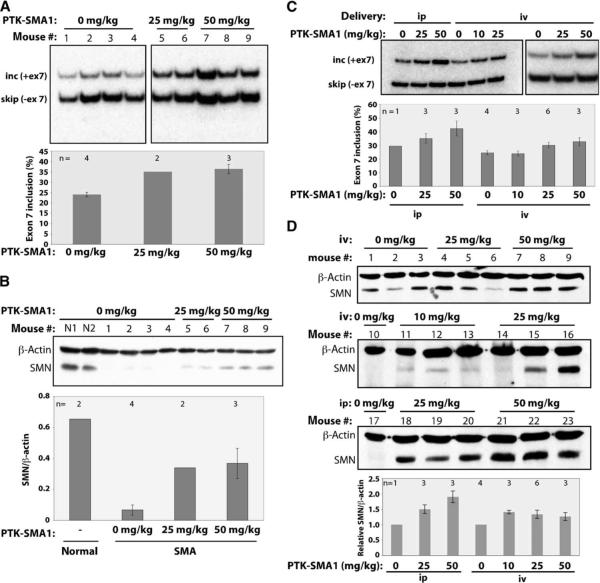
There is at present no cure or effective therapy for spinal muscular atrophy (SMA), a neurodegenerative disease that is the leading genetic cause of infant mortality. SMA usually results from loss of the SMN1 (survival of motor neuron 1) gene, which leads to selective motor neuron degeneration. SMN2 is nearly identical to SMN1 but has a nucleotide replacement that causes exon 7 skipping, resulting in a truncated, unstable version of the SMA protein. SMN2 is present in all SMA patients, and correcting SMN2 splicing is a promising approach for SMA therapy. We identified a tetracycline-like compound, PTK-SMA1, which stimulates exon 7 splicing and increases SMN protein levels in vitro and in vivo in mice. Unlike previously identified molecules that stimulate SMN production via SMN2 promoter activation or undefined mechanisms, PTK-SMA1 is a unique therapeutic candidate in that it acts by directly stimulating splicing of exon 7. Synthetic small-molecule compounds such as PTK-SMA1 offer an alternative to antisense oligonucleotide therapies that are being developed as therapeutics for a number of disease-associated splicing defects.


Figures

Fig. 1
Fig. 1
Identification of compounds that increase SMN2 exon 7 splicing in vitro. (A) Schematic of the 3′ region of the SMN1 and SMN2 genes. SMN1 has a C at position 6 of exon 7 and SMN2 has a T. Hatched lines depict predominant splicing pathway for the respective gene transcripts. (B) Cell-free splicing analysis of SMN2 minigene transcript in HeLa cell nuclear extract in the presence of PTK-SMA1 (2.5, 5, and 10 μM), aclarubicin (Acla) (40 and 80 μM), and indoprofen (Ind) (20 and 40 μM). Lane 1, addition of vehicle only; lane 2, positive control with an antisense PNA peptide that promotes exon 7 inclusion (65). (C) Quantitation of SMN2 exon 7 splicing in vitro. Bars indicate the % exon 7 inclusion [included / (included + skipped) × 100]. Triangles indicate increasing concentrations of compounds: PTK-SMA1 (5 and 10 μM), aclarubicin (40 and 80 μM), valproic acid (VPA) (20 and 40 μM), kinetin (5 and 10 μM), and salbutamol (Sal) (5 and 10 μM). Error bars represent SEM (n = 3). **P < 0.005, t test.
Fig. 2
Fig. 2
The tetracycline derivative PTK-SMA1 promotes SMN2 exon 7 inclusion. (A) Chemical structures of PTK-SMA1, minocycline, and doxycycline. (B) Quantitation of SMN2 exon 7 in vitro splicing in untreated reactions or reactions incubated with PTK-SMA1 (n = 4), minocycline (n = 3), or doxycycline (n = 4) at each of the indicated final concentrations. Results are plotted as the % exon 7 inclusion, as in Fig. 1C. Error bars represent SEM. **P < 0.005, ***P < 0.0005 relative to untreated, t test. (C) SMN exon 7 splicing in vitro. SMN2 was incubated in the absence (−) or presence of increasing amounts of PTK-SMA1 (lanes 5 to 13: 0.625, 1.25, 2.5, 5, 10, 20, 40, 80, and 160 μM, respectively). PNA indicates the addition of SMN-RS10 PNA peptide (65). SMN1 pre-mRNA was spliced in lanes 1 and 2 as a control. (D) Quantitation of in vitro splicing of SMN1 and SMN2 exon 7 splicing and the stimulation of SMN2 exon 7 by PTK-SMA1 at peak activity. Error bars represent SEM (n = 380). ***P < 0.0005 relative to untreated.
Fig. 3
Fig. 3
PTK-SMA1 acts specifically on SMN2 exon 7 splicing. (A) The effect of PTK-SMA1 on splicing in vitro. Splicing reactions with the indicated pre-mRNA substrates were incubated without PTK-SMA1 (−, lanes 1, 4, 8, 11, and 14) or with 5 μM PTK-SMA1 (lanes 2, 6, 9, 12, and 15) or 10 μM PTK-SMA1 (lanes 3, 7, 10, 13, and 16). PNA peptide was used as a positive control for splice-site switching (lane 5) and, in this case, refers to a PNA sequence targeted to the BRCA1 transcript, as previously described (65). Unspliced (un) and spliced (sp) products are indicated. inc and skip refer to spliced products that include or skip exon 18, and prox and dist refer to splicing to proximal or distal alternative 5′ splice sites. (B) Quantification of in vitro splicing. Splicing was calculated as either included / (included + skipped) × 100 (for SMN1 and BRCA1E1694X) or spliced / (unspliced + spliced) × 100 (for 5′Dup, IgM, and β-globin) and then normalized to the value for the corresponding untreated control. SMN2 values are included for comparison and are identical to Fig. 1. Error bars represent SEM (n = 3).
Fig. 4
Fig. 4
PTK-SMA1 stimulates exon 6 to exon 7 splicing and blocks exon 7 skipping. (A) In vitro splicing analysis of SMN2 intron 6. PTK-SMA1 was included in the reactions at final concentrations of 1.25, 2.5, 5, 10, 20, and 40 μM (lanes 2 to 7, respectively). Arrowhead indicates the released intron lariat. (B) Splicing of SMN2 intron 7. PTK-SMA1 was included in the reactions at increasing doses of 1.25, 2.5, 5, 10, and 20 μM (lanes 2 to 6, respectively). (C) SMN2 exon 7 skipping with the SMN2Δex7-5′ss transcript. PTK-SMA1 was included in the reaction at final concentrations of 2.5, 5, 10, 20, 40, and 80 μM (lanes 2 to 7, respectively). Unspliced pre-mRNA transcripts and spliced products are indicated to the right of each gel. (D) Quantitation of splicing from in vitro reactions like those in (A) to (C). Average values are graphed from SMN67 (n = 7;except 2.5 and 40 μM, n = 6), SMN78 (n = 3;except 2.5 and 40 μM, n = 2), and SMN2Δex7-5′ss (n = 2). Error bars represent SEM.
Fig. 5
Fig. 5
PTK-SMA1 increases SMN protein concentration in SMA patient fibroblast cells. Cells were treated with the indicated concentrations of PTK-SMA1. Total protein or RNA was collected after 48 hours. (A) RNA was analyzed by RT-PCR and SMN2 spliced products were separated on a 2% agarose gel. A representative gel is shown. The graph represents the mean % of exon 7 splicing [(included / (included + skipped) × 100] normalized to untreated cells in a series of independent experiments. Error bars show SEM. **P < 0.005. (B) Western blotting with SMN and β-actin antibodies. The plotted data represent the mean change in SMN relative to β-actin protein concentrations in drug-treated cells relative to untreated cells. Error bars represent SEM (n = 5). *P < 0.05, **P < 0.001 relative to control, t test. (C) Gems or Cajal bodies were detected by immunofluorescence microscopy with an SMN antibody. A number of gems were quantitated in untreated 3814 control cells or in 3813 cells treated with the indicated concentrations of PTK-SMA1 or valproic acid. The graph plots the number of gems per 100 cells. Each circle represents an independent experiment and the bar indicates the average of all measurements.
Fig. 6
Fig. 6
PTK-SMA1 increases SMN2 exon 7 splicing and SMN protein concentration in SMA mice. (A) RT-PCR analysis of RNA from liver of type III SMA adult mice (hSMN2+/+; Smn−/−) treated with PTK-SMA1 or vehicle control. Transcripts including and skipping human SMN2 exon 7 are labeled. The plotted data represent the mean % exon 7 inclusion in PTK-SMA1-treated and control mice. Error bars represent the SEM, with n displayed above the respective bars. (B) Western blot analysis of protein lysates from liver isolated from mice treated with PTK-SMA1. β-Actin was used as a loading control. Mean SMN to β-actin ratios are shown graphically. Error bars represent the SEM. (C) RT-PCR analysis of RNA from liver of transgenic SMA adult mice (hSMN2+/+; Smn+/+ or hSMN2+/+; Smn+/−) treated with PTK-SMA1 by intravenous (iv) or intraperitoneal (ip) injection. Representative samples are shown. The graph represents the mean % exon 7 inclusion in PTK-SMA1–treated and control mice. Error bars represent SEM, with n displayed above the respective bars. (D) Western blot analysis of liver protein lysates probed with a human-specific SMN antibody. β-Actin was used as a loading control. Mean SMN to β-actin ratios normalized to untreated samples are shown graphically. Error bars represent the SEM of values from samples shown in blots.

References

    1. Lefebvre S, Bürglen L, Reboullet S, Clermont O, Burlet P, Viollet L, Benichou B, Cruaud C, Millasseau P, Zeviani M, Le Paslier D, Frézal J, Cohen D, Weissenbach J, Munnich A, Melki J. Identification and characterization of a spinal muscular atrophy-determining gene. Cell. 1995;80:155–165. - PubMed
    1. Munsat TL, Davies KE. Neuromuscul. Disord; International SMA consortium meeting; Bonn, Germany. 26–28 June 1992; 1992. pp. 423–428. - PubMed
    1. Neuenkirchen N, Chari A, Fischer U. Deciphering the assembly pathway of Sm-class U snRNPs. FEBS Lett. 2008;582:1997–2003. - PubMed
    1. Pellizzoni L. Chaperoning ribonucleoprotein biogenesis in health and disease. EMBO Rep. 2007;8:340–345. - PMC - PubMed
    1. Wahl MC, Will CL, Lührmann R. The spliceosome: Design principles of a dynamic RNP machine. Cell. 2009;136:701–718. - PubMed