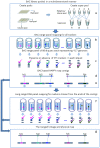
BAC-HAPPY mapping (BAP mapping): a new and efficient protocol for physical mapping
- PMID: 20161702
- PMCID: PMC2816996
- DOI: 10.1371/journal.pone.0009089
BAC-HAPPY mapping (BAP mapping): a new and efficient protocol for physical mapping
Abstract
Physical and linkage mapping underpin efforts to sequence and characterize the genomes of eukaryotic organisms by providing a skeleton framework for whole genome assembly. Hitherto, linkage and physical "contig" maps were generated independently prior to merging. Here, we develop a new and easy method, BAC HAPPY MAPPING (BAP mapping), that utilizes BAC library pools as a HAPPY mapping panel together with an Mbp-sized DNA panel to integrate the linkage and physical mapping efforts into one pipeline. Using Arabidopsis thaliana as an exemplar, a set of 40 Sequence Tagged Site (STS) markers spanning approximately 10% of chromosome 4 were simultaneously assembled onto a BAP map compiled using both a series of BAC pools each comprising 0.7x genome coverage and dilute (0.7x genome) samples of sheared genomic DNA. The resultant BAP map overcomes the need for polymorphic loci to separate genetic loci by recombination and allows physical mapping in segments of suppressed recombination that are difficult to analyze using traditional mapping techniques. Even virtual "BAC-HAPPY-mapping" to convert BAC landing data into BAC linkage contigs is possible.
Conflict of interest statement
Figures


Similar articles
-
Sequence-based physical mapping of complex genomes by whole genome profiling.Genome Res. 2011 Apr;21(4):618-25. doi: 10.1101/gr.112094.110. Epub 2011 Feb 1. Genome Res. 2011. PMID: 21324881 Free PMC article.
-
A plant-transformation-competent BIBAC/BAC-based map of rice for functional analysis and genetic engineering of its genomic sequence.Genome. 2007 Mar;50(3):278-88. doi: 10.1139/g07-006. Genome. 2007. PMID: 17502901
-
Sequencing of 6.7 Mb of the melon genome using a BAC pooling strategy.BMC Plant Biol. 2010 Nov 12;10:246. doi: 10.1186/1471-2229-10-246. BMC Plant Biol. 2010. PMID: 21073723 Free PMC article.
-
Feasibility of physical map construction from fingerprinted bacterial artificial chromosome libraries of polyploid plant species.BMC Genomics. 2010 Feb 19;11:122. doi: 10.1186/1471-2164-11-122. BMC Genomics. 2010. PMID: 20170511 Free PMC article.
-
A BAC- and BIBAC-based physical map of the soybean genome.Genome Res. 2004 Feb;14(2):319-26. doi: 10.1101/gr.1405004. Epub 2004 Jan 12. Genome Res. 2004. PMID: 14718376 Free PMC article.
Cited by
-
Whole-Genome Restriction Mapping by "Subhaploid"-Based RAD Sequencing: An Efficient and Flexible Approach for Physical Mapping and Genome Scaffolding.Genetics. 2017 Jul;206(3):1237-1250. doi: 10.1534/genetics.117.200303. Epub 2017 May 3. Genetics. 2017. PMID: 28468906 Free PMC article.
-
Major genes determining yield-related traits in wheat and barley.Theor Appl Genet. 2017 Jun;130(6):1081-1098. doi: 10.1007/s00122-017-2880-x. Epub 2017 Mar 17. Theor Appl Genet. 2017. PMID: 28314933 Free PMC article. Review.
-
Fine mapping and syntenic integration of the semi-dwarfing gene sdw3 of barley.Funct Integr Genomics. 2010 Nov;10(4):509-21. doi: 10.1007/s10142-010-0173-4. Epub 2010 May 13. Funct Integr Genomics. 2010. PMID: 20464438
-
An introduction to the medicinal plant genome project.Front Med. 2011 Jun;5(2):178-84. doi: 10.1007/s11684-011-0131-0. Epub 2011 Jun 22. Front Med. 2011. PMID: 21695623 Review.
-
Whole Genome Mapping with Feature Sets from High-Throughput Sequencing Data.PLoS One. 2016 Sep 9;11(9):e0161583. doi: 10.1371/journal.pone.0161583. eCollection 2016. PLoS One. 2016. PMID: 27611682 Free PMC article.
References
Publication types
MeSH terms
Substances
Grants and funding
LinkOut - more resources
Full Text Sources
Other Literature Sources
Miscellaneous

