

G protein coupled receptors in embryonic stem cells: a role for Gs-alpha signaling
- PMID: 20161705
- PMCID: PMC2816999
- DOI: 10.1371/journal.pone.0009105
G protein coupled receptors in embryonic stem cells: a role for Gs-alpha signaling
Abstract
Background: Identification of receptor mediated signaling pathways in embryonic stem (ES) cells is needed to facilitate strategies for cell replacement using ES cells. One large receptor family, largely uninvestigated in ES cells, is G protein coupled receptors (GPCRs). An important role for these receptors in embryonic development has been described, but little is known about GPCR expression in ES cells.
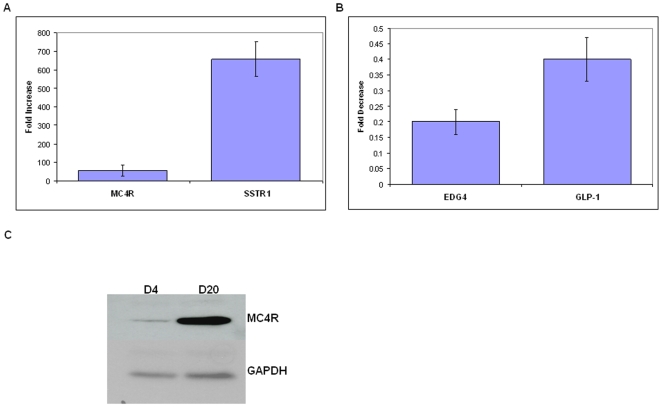
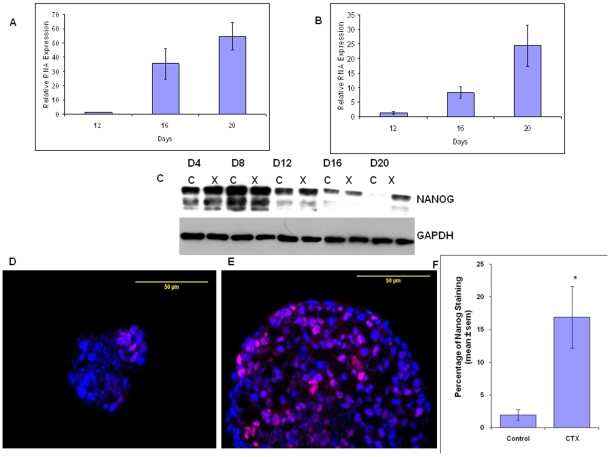
Methodology/principal findings: We have examined the expression profile of 343 different GPCRs in mouse ES cells demonstrating for the first time that a large number of GPCRs are expressed in undifferentiated and differentiating ES cells, and in many cases at high levels. To begin to define a role for GPCR signaling in ES cells, the impact of activating Gs-alpha, one of the major alpha subunits that couples to GPCRs, was investigated. Gs-alpha activation resulted in larger embryoid bodies (EBs), due, in part, to increased cell proliferation and prevented the time-related decline in expression of transcription factors important for maintaining ES cell pluripotency.
Significance/conclusions: These studies suggest that Gs-alpha signaling contributes to ES cell proliferation and pluripotency and provide a framework for further investigation of GPCRs in ES cells.
Conflict of interest statement
Figures


Similar articles
-
Constitutive Gs activation using a single-construct tetracycline-inducible expression system in embryonic stem cells and mice.Stem Cell Res Ther. 2011 Mar 4;2(2):11. doi: 10.1186/scrt52. Stem Cell Res Ther. 2011. PMID: 21375737 Free PMC article.
-
Assessing the osteoblast transcriptome in a model of enhanced bone formation due to constitutive Gs-G protein signaling in osteoblasts.Exp Cell Res. 2015 May 1;333(2):289-302. doi: 10.1016/j.yexcr.2015.02.009. Epub 2015 Feb 20. Exp Cell Res. 2015. PMID: 25704759 Free PMC article.
-
Inhibition of transforming growth factor β (TGF-β) signaling can substitute for Oct4 protein in reprogramming and maintain pluripotency.J Biol Chem. 2015 Feb 13;290(7):4500-11. doi: 10.1074/jbc.M114.609016. Epub 2014 Dec 29. J Biol Chem. 2015. PMID: 25548277 Free PMC article.
-
Gs/Gi Regulation of Bone Cell Differentiation: Review and Insights from Engineered Receptors.Horm Metab Res. 2016 Nov;48(11):689-699. doi: 10.1055/s-0042-116156. Epub 2016 Sep 19. Horm Metab Res. 2016. PMID: 27643449 Review.
-
Gs signaling in osteoblasts and hematopoietic stem cells.Ann N Y Acad Sci. 2010 Mar;1192:327-9. doi: 10.1111/j.1749-6632.2009.05251.x. Ann N Y Acad Sci. 2010. PMID: 20392255 Review.
Cited by
-
Chemokine GPCR signaling inhibits β-catenin during zebrafish axis formation.PLoS Biol. 2012;10(10):e1001403. doi: 10.1371/journal.pbio.1001403. Epub 2012 Oct 9. PLoS Biol. 2012. PMID: 23055828 Free PMC article.
-
Genome-wide profiling of G protein-coupled receptors in cerebellar granule neurons using high-throughput, real-time PCR.BMC Genomics. 2011 May 16;12:241. doi: 10.1186/1471-2164-12-241. BMC Genomics. 2011. PMID: 21575240 Free PMC article.
-
Genetically Encoded Photoactuators and Photosensors for Characterization and Manipulation of Pluripotent Stem Cells.Theranostics. 2017 Aug 18;7(14):3539-3558. doi: 10.7150/thno.20593. eCollection 2017. Theranostics. 2017. PMID: 28912894 Free PMC article. Review.
-
Optogenetic Stimulation of Gi Signaling Enables Instantaneous Modulation of Cardiomyocyte Pacemaking.Front Physiol. 2021 Dec 20;12:768495. doi: 10.3389/fphys.2021.768495. eCollection 2021. Front Physiol. 2021. PMID: 34987414 Free PMC article.
-
Essential Role of Adhesion GPCR, GPR123, for Human Pluripotent Stem Cells and Reprogramming towards Pluripotency.Cells. 2023 Jan 13;12(2):304. doi: 10.3390/cells12020304. Cells. 2023. PMID: 36672239 Free PMC article.
References
-
- Cabrera-Vera TM, Vanhauwe J, Thomas TO, Medkova M, Preininger A, et al. Insights into G protein structure, function, and regulation. Endocr Rev. 2003;24:765–781. - PubMed
-
- Okita K, Yamanaka S. Intracellular signaling pathways regulating pluripotency of embryonic stem cells. Curr Stem Cell Res Ther. 2006;1:103–111. - PubMed
-
- Trounson A, Elefanty A. Stem cells in biology, tissue engineering and medicine: the leading edge keeps moving. Curr Opin Biotechnol. 2007;18:432–433. - PubMed
-
- Ying Q–L, Nichols J, Chambers I, Smith A. BMP Induction of Id Proteins Suppresses Differentiation and Sustains Embryonic Stem Cell Self-Renewal in Collaboration with STAT3. Cell. 2003;115:281–292. - PubMed
-
- Feng GS. Shp2-mediated molecular signaling in control of embryonic stem cell self-renewal and differentiation. Cell Res. 2007;17:37–41. - PubMed
Publication types
MeSH terms
Substances
LinkOut - more resources
Full Text Sources
