. 2010 Feb 8;5(2):e9062.
doi: 10.1371/journal.pone.0009062.

DKK1 mediated inhibition of Wnt signaling in postnatal mice leads to loss of TEC progenitors and thymic degeneration

Affiliations

DKK1 mediated inhibition of Wnt signaling in postnatal mice leads to loss of TEC progenitors and thymic degeneration

Masako Osada et al. PLoS One. .

Abstract

Background: Thymic epithelial cell (TEC) microenvironments are essential for the recruitment of T cell precursors from the bone marrow, as well as the subsequent expansion and selection of thymocytes resulting in a mature self-tolerant T cell repertoire. The molecular mechanisms, which control both the initial development and subsequent maintenance of these critical microenvironments, are poorly defined. Wnt signaling has been shown to be important to the development of several epithelial tissues and organs. Regulation of Wnt signaling has also been shown to impact both early thymocyte and thymic epithelial development. However, early blocks in thymic organogenesis or death of the mice have prevented analysis of a role of canonical Wnt signaling in the maintenance of TECs in the postnatal thymus.

Methodology/principal findings: Here we demonstrate that tetracycline-regulated expression of the canonical Wnt inhibitor DKK1 in TECs localized in both the cortex and medulla of adult mice, results in rapid thymic degeneration characterized by a loss of DeltaNP63(+) Foxn1(+) and Aire(+) TECs, loss of K5K8DP TECs thought to represent or contain an immature TEC progenitor, decreased TEC proliferation and the development of cystic structures, similar to an aged thymus. Removal of DKK1 from DKK1-involuted mice results in full recovery, suggesting that canonical Wnt signaling is required for the differentiation or proliferation of TEC populations needed for maintenance of properly organized adult thymic epithelial microenvironments.

Conclusions/significance: Taken together, the results of this study demonstrate that canonical Wnt signaling within TECs is required for the maintenance of epithelial microenvironments in the postnatal thymus, possibly through effects on TEC progenitor/stem cell populations. Downstream targets of Wnt signaling, which are responsible for maintenance of these TEC progenitors may provide useful targets for therapies aimed at counteracting age associated thymic involution or the premature thymic degeneration associated with cancer therapy and bone marrow transplants.


Conflict of interest statement

Competing Interests: The authors have declared that no competing interests exist.

Figures

Figure 1
Figure 1. Relative expression of Dkk1, Wnt target genes and Foxn1 in sorted TECs (CD45 MHCII+EpCAM+) as well as TECs in vivo.
4-week old tetO-Dkk1;K5rtTA and tetO-Dkk1-ST littermate mice were fed Dox food for 4 weeks prior to harvest and enzymatic dissociation of thymic tissue. Viable CD45MHCII+EpCAM+ TECs were sorted to >98%purity by FACS. Subsequent to mRNA isolation, real-time PCR was performed using primer and probe sets specific to Dkk1, Axin2, c-Myc, Foxn1 and GAPDH. Relative Dkk1, Axin2, c-Myc and Foxn1 expression were normalized against endogenous GAPDH expression. (A) Relative expression of the Dkk1 transgene following 4-week Dox induction in TECs. (B) Relative expression of the Wnt target genes Axin2, c-Myc and Foxn1 in sorted TECs following 4-week Dox induction of the Wnt inhibitor Dkk1. (C) Representative 400X confocal scans of the thymic cortex of ST (left) and TetO-Dkk1 (right) thymus following a 4-week Dox feeding to demonstrate the reduced Foxn1 protein expression resulting from DKK1 transgene induction. Sections were stained with K14 (pink) Foxn1 (green) and DEC205 (not shown for clarity of Foxn1 analysis). Red arrow in each scan shows the position and direction of a line scan used to generate the quantitative analysis of Foxn1 protein expression shown in the histograms below each image. White arrows show the edge of the thymic section. (D) Histogram comparing mean Foxn1 fluorescence intensity in cTECs vs. mTECs. The mean Foxn1 fluorescence intensity was calculated from both cTECs and mTECs derived from 4-week Dox treated ST or TetO-Dkk1 mice (based on their location within DEC205+ and K14+ regions of the thymus). Means for each location and strain were calculated from a total of 85 individual cells from 3 independent experiments. Error bars in the histograms represent standard deviation. **Statistical significance was determined using a T test and P<.001.
Figure 2
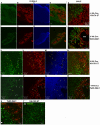
Figure 2. Doxycycline-regulated expression of the DKK1 transgene is evident in both cTECs and mTECs in the adult thymus.
Following a 4-week Dox induction, 12 µm frozen thymic sections were prepared from ST control and TetO-Dkk1 mice and subjected to in situ hybridization with a DKK1 specific probe followed by detection with Sections were then counterstained with anti-Keratin 8 and anti-keratin 5 antibodies to allow localization the DKK1 expression to specific thymic regions and to cortical and medullary TEC subsets. Each row of photos shows in situ hybridization with a DKK1 specific probe followed by Immunofluorescent staining with K8 (green), K5 (red) and a merge of all three. K5rtTA-ST control lobes show little endogenous DKK1 expression at 100X (A–D) or 400X (E–H). In contrast, Dox induction resulted in widespread transgenic expression of DKK1 in the TetO-Dkk1 mice with positive TECs being more abundant in the K8 dominated cortex than the K5 dominated medulla when examined at 100X (I–L). High magnification examination of the thymic cortex of TetO-Dkk1 mice revealed that a high percentage of K5K8DP and a smaller number of K8+ cTECs exhibited strong DKK1 transgene expression. White arrows in all panels identify DKK1-expressing TECs, thus allowing characterization of the keratin profile (M–P). Surprisingly, more limited transgenic DKK1 expression was evident in the medulla, with a small percentage of the K5-expressing mTECs and a higher frequency of the K5K8DP TECs at the cortico-medullary junction expressing DKK1 (Q–T).
Figure 3
Figure 3. Effect of DKK1 expression on thymus size.
Upper row shows photographs of intact thymic lobes to demonstrate the dramatic thymic involution observed after 4 weeks of doxycycline driven Dkk1 expression. (A) Control Male K5rtTA-ST, (B) Male TetO-Dkk1 and (C) Female TetO-Dkk1. Lower row demonstrates the recovery of thymic size of doxycycline treated lobes following a 4 weeks chase period. (D) Control Female K5rtTA-ST, (E) Male TetO-Dkk1, (F) Female TetO-Dkk1. Female K5rtTA-ST mice exhibited a similar thymic size to male controls after Dox feeding, as did Male K5rtTA-ST mice after 4 weeks Dox feeding and 4 weeks chase (data not shown).
Figure 4
Figure 4. Effect of DKK1 on total thymocyte number and subset frequency.
A. Thymocyte FACS profiles representative of 4 independent experiments showing the frequency of thymocyte subsets including the DN1-SP subsets. No apparent differences in profile between Dox fed TetO-Dkk1 male and female when compared with similarly treated K5rtTA littermate controls. B. Total thymocyte number is dramatically reduced in both male and female TetO-Dkk1 mice following 4 weeks of Dox feeding, when compared with Dox fed ST littermate controls. C. Following 4 weeks of Dox feeding, FACS analysis of thymocytes derived from either male or female TetO-Dkk1 mice showed no changes in the frequency of individual thymocyte subsets. (The frequency of individual DN subsets represents the frequency of the total number of CD4-CD8- cells) Means for each subset were determined from 4 independent experiments with at least 3 mice of each sex and genotype.
Figure 5
Figure 5. Effect of Dkk1 expression on the distribution of TEC subsets defined by K5 and K8 expression.
Frozen thymic sections prepared from K5rtTA-ST and TetO-Dkk1 mice after 4 weeks of doxycycline feeding to induce DKK1 expression. Low magnification images of thymic sections derived from female K5rtTA-ST mice (A–D) and TetO-Dkk1 mice (F–I) stained with anti-K8 (green) to identify the cortex and anti-K5 (red) to identify the medulla as well as DAPI. Merged images of K5 and K8 staining (D vs. I) reveal K5K8DP TECs thought to contain progenitors (yellow). Similar images of merged K5 and K8 staining from male K5rtTA-ST (E) and TetO-Dkk1 mice (J) reveal a more dramatic loss of cortical architecture and altered cTEC morphology. * -Identify cystic structures and abundant keratin negative areas (KNA) in the TetO-Dkk1 mice. Higher magnification images of female K5rtTA-ST mice stained with K5 and K8 antibodies reveal abundant K5K8DP TEC progenitors at the CMJ as well as within the medulla (K–N, yellow arrows). (White arrows show K8SP thought to be mature mTECs) Similar sections derived from littermate TetO-Dkk1 mice reveal an absence of the K5K8DP TEC progenitors at both the CMJ and within the medulla (O–R). Further evidence of the hypoplastic cortex and loss of the reticular cTEC network is revealed when TetO-Dkk1 mice with severe phenotypes are stained the cTEC specific DEC205 antibody (green) and UEA1 (red) to define medullary areas. (S). Compared with similar staining of K5rtTA-ST littermate mice (T). A dramatic loss of cortical area and the typical reticular cTEC morphology is apparent in the TetO-Dkk1 thymus. White arrows show the outer edge of the thymus.
Figure 6
Figure 6. FACS Analysis of TEC profile and quantification of TEC numbers in response to DKK1 mediated inhibition of Wnt signaling.
Following a 4-week Dox induction of DKK1 expression, thymic lobes from TetO-Dkk1 and K5rtTA-ST littermate mice were dissociated using Collagenase/Dispase/DNase digestion. CD45 magnetic beads were used to partially deplete CD45+ hematopoietic cells from the resulting single cell suspension, prior to staining with antibodies against CD45, MHCII, EpCAM, and CD80 together with UEA1 lectin. TetO-Dkk1 mice showed a dramatic decrease in the frequency of EpCAM+ MHCII+ CD45 TECs (A, upper left) when compared with K5rtTA-ST controls (A, upper right panel). Further analysis of the CD45-EpCAM+ TECs using the MHCII and EpCAM to distinguish the MHCIIlo immature and MHChi mature TEC subsets, revealed no differences in the frequency of these subsets (A, third set of panels) Similarly, separation of the UEA1+ mTECs into UEA1+CD80hi mature and UEA1+CD80lo/neg immature mTEC subsets, revealed no affect of DKK1 induction on the frequency of mTEC subsets (A, lower set of panels). (B) Comparison of the mean total CD45MHCII+EpCAM+ TEC numbers and the mean number of each TEC subset including EpCAM+UEA1 cTECs, EpCAM+ UEA1+ mTECs, EpCAM+MHChi mature TECs, EpCAM+MHClo Immature TECs, UEA1+CD80lo immature mTECs and UEA1+CD80hi mature mTECs, following 4-weeks Dox feeding. Means represent the total cell number/thymus, calculated from 3 independent experiments utilizing 5-pooled dissociated thymi from each strain. Error bars show standard deviation. * P<.005 demonstrating significant reductions in TEC number for all subsets analyzed (C) Dox treatment of TetO-Dkk1 mice results in an increase in the mean mTEC/cTEC ratio (blue bar) when compared to identically treated K5rtTA-ST mice (red bar). Means calculated based on 3 independent experiments as described above. Error bars =  standard deviation. P = .025.
Figure 7
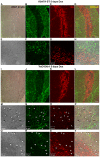
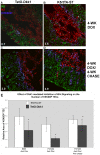
Figure 7. Inhibition of Wnt signaling leads to a decline in the number of K5K8DP TECs thought to contain a TEC progenitor population.
A dramatic reduction in the abundance of K5K8DP TECs is apparent in confocal images of thymic sections derived from TetO-Dkk1 (A) when compared with K5rtTA-ST littermate animals (B) following 4 weeks of doxycycline feeding. These K5K8DP TECs reappear in 4-wk Dox treated TetO-Dkk1 mice following a 4 weeks chase of doxycycline withdrawal (C) possessing a similar frequency of K5K8DP TECs to that of similarly treated K5rtTA-ST mice (D). TECs, which exhibited fluorescence intensities 5% above the mean fluorescent background for K5 and K8 and co-expressing both keratins, are colored blue using the Zeiss LSM image analysis software. The relative percentage of TECs co-expressing K5 and K8 is shown by the white numbers in the lower left corner of each image. (Magnification = 200×) (E) The mean relative area of K5K8DP TECs in male and female K5rtTA-ST mice (White bars) and TetO-Dkk1 mice (Gray bars) following 4 weeks of Dox feeding and in female mice following a 4 weeks Dox chase experiment. Error bars show standard deviation. * - P value <.005. ** - P value no longer significant following recovery period. Means were calculated based on 5 independent experiments, which analyzed a minimum of 6 sections cut from various locations within the thymus of each strain (TetO-Dkk1 versus ST littermate) and each sex (N = 30).
Figure 8
Figure 8. DKK1 Expression results in reduced ΔNp63+ and Aire+ TECs.
Thymic sections derived from female TetO-Dkk1 (left column) and K5rtTA-ST mice (right column) stained with Anti-ΔNp63 (green), Anti-Aire (red) and UEA-1 (blue). A–E show thymic sections derived following 4 weeks of doxycycline feeding. Low magnification images of a large area of thymus from TetO-Dkk1 mice (A) compared with the K5rtTA-ST (B). Higher magnification images of the cortex (C & D) and medulla (E & F) in TetO-Dkk1 and K5rtTA-ST, respectively. Low magnification images of 4 week Dox treated thymic tissue derived from TetO-Dkk1 (G) or K5rtTA-ST animals following a 4-week recovery period.
Figure 9
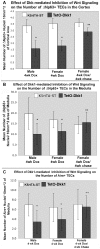
Figure 9. Effect of inhibition of Wnt signaling in the adult thymus on the number of ΔNp63+ and Aire +TECs.
(A) The mean number of ΔNp63+ nuclei/10 mm2 area of cortex, calculated for K5rtTA-ST (white bars) and TetO-Dkk1 (gray bars) following 4 weeks of Dox feeding and after a 4 weeks Dox chase. (B) The mean number of ΔNp63+ nuclei/10 mm2 area of medulla, calculated for K5rtTA-ST (white bars) and TetO-Dkk1 (gray bars) following 4 weeks of Dox feeding and after a 4 weeks Dox chase. (C) The mean number of Aire+ nuclei/10 mm2 area of medulla, calculated for K5rtTA-ST (white bars) and TetO-Dkk1 (gray bars) following 4 weeks of Dox feeding and after a 4 weeks Dox chase. *-P value <.01, **- no longer significant.
Figure 10
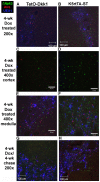
Figure 10. Inhibition of canonical Wnt signaling through transgenic expression of DKK1 leads to reduced proliferation of TECs.
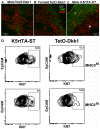
Sections of thymus derived from (A) Male,TetO-Dkk1 (B) Female TetO-Dkk1 and (C) Male K5rtTA-ST littermate control animals stained with anti-Pan-keratin antibody (red) and anti-Ki67 antibody after 4 weeks of Dox feeding. FACS analysis of dissociated thymic tissue derived from similarly treated female TETO-DKK1 and control ST mice revealed only a slight reduction in Ki67+ cells within the mature CD45 MHCIIhi EpCAM+ TEC subset in TetO-Dkk1 mice (D, upper panels). In contrast, a greater than 50% reduction in the frequency of cycling Ki67+ TECs was observed in the immature CD45 MHCIIlow EpCAM+ TEC subset in TetO-Dkk1 mice, when compared with Dox-treated ST littermate controls (D, lower panels). Positive gates for Ki67 staining within each sample were determined using rabbit isotype control antibody. The FACS data presented in D is derived from 5-pooled mice of each strain and the results are representative of 3 independent experiments.
Figure 11
Figure 11. TEC TUNEL Assay: The effect of DKK1-mediated inhibition of canonical Wnt signaling on apoptosis in TECs.
The gating strategy used to analyze total CD45EpCAM+ TECs derived from TetO-Dkk1 female mice (A) and K5rtTA-ST littermate female control mice (B) after 4 weeks of Dox feeding to induce DKK1 expression. An overlay of the TUNEL staining for TECs from TetO-Dkk1 and K5rtTA-ST mice, as well as TetO-Dkk1 TECs, stained in the absence of TDT as a negative control (C), reveals no difference in apoptosis with the TECs.

Similar articles

Cited by

References

    1. Anderson G, Jenkinson EJ. Lymphostromal interactions in thymic development and function. Nat Rev Immunol. 2001;1:31–40. - PubMed
    1. Savage PA, Davis MM. A kinetic window constricts the T cell receptor repertoire in the thymus. Immunity. 2001;14:243–252. - PubMed
    1. van Ewijk W, Wang B, Hollander G, Kawamoto H, Spanopoulou E, et al. Thymic microenvironments, 3-D versus 2-D? Semin Immunol. 1999;11:57–64. - PubMed
    1. van Ewijk W, Hollander G, Terhorst C, Wang B. Stepwise development of thymic microenvironments in vivo is regulated by thymocyte subsets. Development. 2000;127:1583–1591. - PubMed
    1. Itoi M, Tsukamoto N, Yoshida H, Amagai T. Mesenchymal cells are required for functional development of thymic epithelial cells. Int Immunol. 2007;19:953–964. - PubMed

Publication types

MeSH terms

LinkOut - more resources