Comparative Study
. 2010 Feb 9;4(2):e600.
doi: 10.1371/journal.pntd.0000600.

Transcriptional changes in Schistosoma mansoni during early schistosomula development and in the presence of erythrocytes

Affiliations
Comparative Study

Transcriptional changes in Schistosoma mansoni during early schistosomula development and in the presence of erythrocytes

Geoffrey N Gobert et al. PLoS Negl Trop Dis. .

Abstract

Background: Schistosomes cause more mortality and morbidity than any other human helminth, but control primarily relies on a single drug that kills adult worms. The newly transformed schistosomulum stage is susceptible to the immune response and is a target for vaccine development and rational drug design.

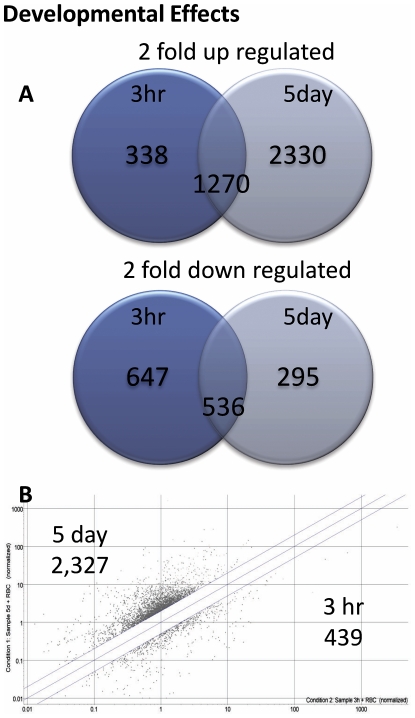
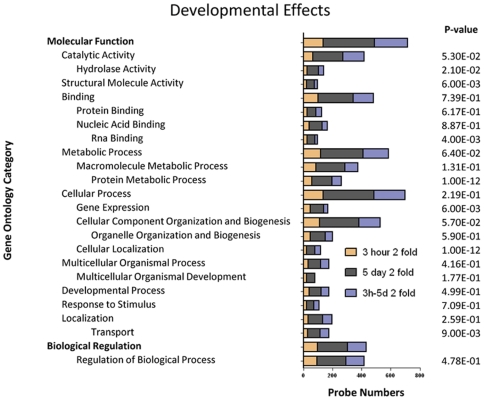
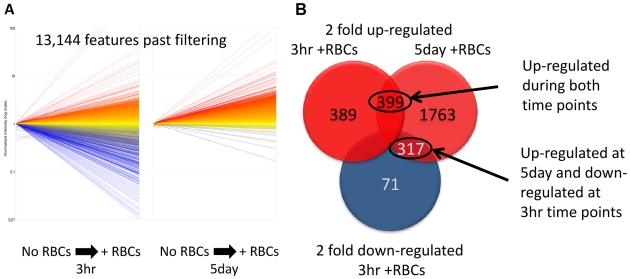
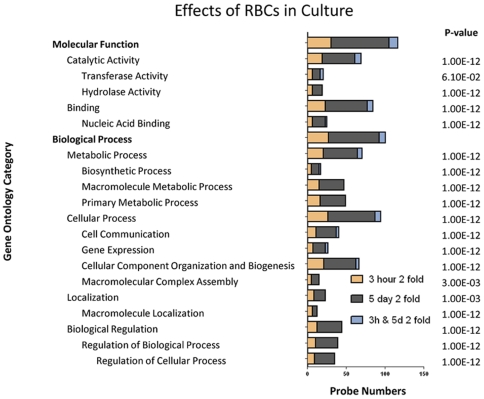
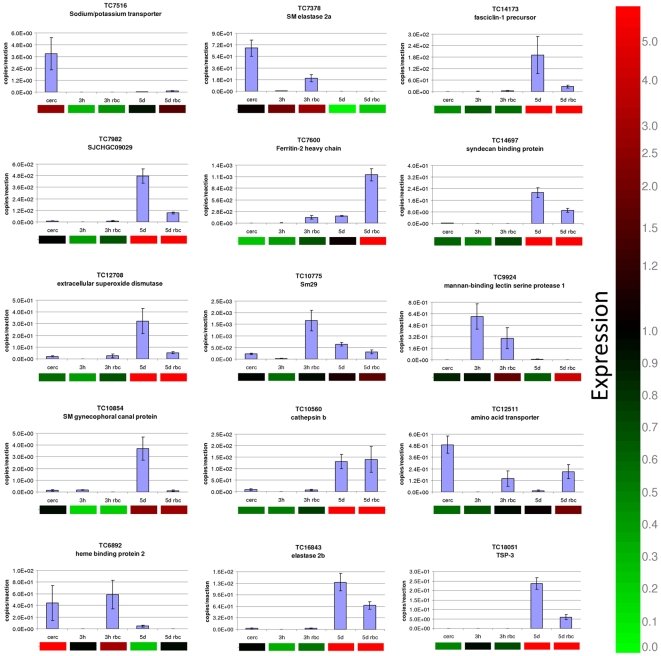
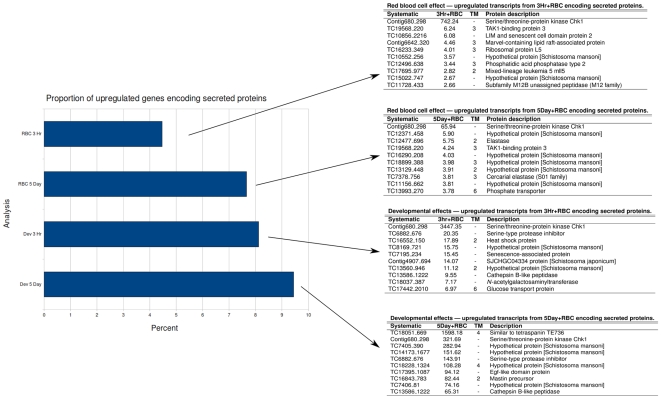
Methodology/principal findings: To identify genes which are up-regulated during the maturation of Schistosoma mansoni schistosomula in vitro, we cultured newly transformed parasites for 3 h or 5 days with and without erythrocytes and compared their transcriptional profiles using cDNA microarrays. The most apparent changes were in the up-regulation of genes between 3 h and 5 day schistosomula involved in blood feeding, tegument and cytoskeletal development, cell adhesion, and stress responses. The most highly up-regulated genes included a tegument tetraspanin Sm-tsp-3 (1,600-fold up-regulation), a protein kinase, a novel serine protease and serine protease inhibitor, and intestinal proteases belonging to distinct mechanistic classes. The inclusion of erythrocytes in the culture medium resulted in a general but less pronounced increase in transcriptional activity, with the highest up-regulation of genes involved in iron metabolism, proteolysis, and transport of fatty acids and sugars.

Conclusions: We have identified the genes that are up-regulated during the first 5 days of schistosomula development in vitro. Using a combination of gene silencing techniques and murine protection studies, some of these highly up-regulated transcripts can be targeted for future development of new vaccines and drugs.


Conflict of interest statement

The authors have declared that no competing interests exist.

Figures

Figure 1
Figure 1. The number of genes differentially expressed between cercariae and 3 h or 5 day cultured S. mansoni schistosomula.
(A) The number of genes either up- or down- regulated >2 fold in 3 h or 5 day schistosomula relative to gene expression in cercariae. Numbers in the overlapping region of the Venn diagram indicate genes that were differentially expressed at 3 h and 5 days. (B) Scatter plot of individual gene signal intensity of 3 h and 5 day schistosomula, with a 2-fold cut off, demonstrating the change in gene expression between the two time points.
Figure 2
Figure 2. Major gene ontology categories up-regulated during schistosomula transformation.
Gene ontologies of up-regulated genes during the transformation of S. mansoni cercariae to 3 h schistosomula, cercariae to 5 day schistosomula, and from 3 h to 5 day schistosomula. The P-value indicates the significance of the gene ontology category based on the number and degree of differentially expressed genes within each category. Categories with a P-value ≤0.05 were deemed significant; to show the position of these sub-categories within the GO tree hierarchy, parent categories with a P-value >0.05 were also included. Categories with P-value >0.05 may indicate that only a small percentage of the genes were differentially expressed.
Figure 3
Figure 3. Number of genes differentially expressed in 3 h and 5 day cultured S. mansoni schistosomula in the presence of erythrocytes.
(A) Scatter plot of the overall change in expression of 3 h and 5 day old schistosomula, cultured in the presence of erythrocytes and normalised to parasites cultured without erythrocytes. Relative up-regulation is shown in red, and relative down-regulation in blue. No differential gene expression is presented in yellow (B) Number of genes either up- or down-regulated >2-fold in 3 h or 5 day schistosomula cultured in the presence of erythrocytes relative to parasites cultured without erythrocytes; numbers in the overlapping region of the Venn diagram indicate genes that were differentially expressed in more than one group. Relative up-regulation is shown in red, and relative down-regulation in blue. Number of up-regulated genes in both time points (3 h and 5 day) and number of genes up-regulated at 5 day but down-regulated at 3 h time points are circled and annotated.
Figure 4
Figure 4. Major gene ontology categories of genes that were differentially expressed due to culture of S. mansoni schistosomula in the presence of erythrocytes.
Gene ontologies representing the up-regulated genes in 3 h or 5 day schistosomula, and in both 3 h and 5 day schistosomula due to the presence of erythrocytes in the culture medium. P-values indicate the significance of the number and degree of differential expression within each category. Categories with a P-value ≤0.05 were deemed significant; to show the position of these sub-categories within the GO tree hierarchy, parent categories with a P-value >0.05 were also included. Categories with P-value >0.05 may indicate that only a small percentage of the genes were differentially expressed.
Figure 5
Figure 5. Validation of a subset of differentially expressed genes in 3 h and 5 day schistosomula of S. mansoni cultured in the presence or absence of erythrocytes.
Quantitative real time PCR data, expressed as copy number per reaction, are presented as bar graphs, while the corresponding microarray data are shown below the graphs as heat maps. Microarray gene expression is indicated by up-regulation (red), down-regulation (green) or unchanged (black). The microarray data were not normalised to any sample.
Figure 6
Figure 6. Percentage of genes encoding for secreted/membrane proteins that underwent ≥2-fold increased expression in each category.
All genes that were up-regulated were screened for the presence of a signal peptide or anchor using SignalP; those ORFS with a signal peptide/anchor were then further screened for transmembrane (TM) domains using TMPred. The tables show the ten most highly upregulated genes in each category.

Similar articles

Cited by

References

    1. Doenhoff MJ, Cioli D, Utzinger J. Praziquantel: mechanisms of action, resistance and new derivatives for schistosomiasis. Curr Opin Infect Dis. 2008;21:659–667. - PubMed
    1. Loukas A, Tran M, Pearson MS. Schistosome membrane proteins as vaccines. Int J Parasitol. 2007;37:257–263. - PubMed
    1. McManus DP, Loukas A. Current status of vaccines for Schistosomaisis. Clinical Review of Microbiology. 2008;21:225–242. - PMC - PubMed
    1. Berriman M, Haas BJ, LoVerde PT, Wilson RA, Dillon GP, et al. The genome of the blood fluke Schistosoma mansoni. Nature. 2009;460:352–358. - PMC - PubMed
    1. Braschi S, Borges WC, Wilson RA. Proteomic analysis of the schistosome tegument and its surface membranes. Mem Inst Oswaldo Cruz. 2006;101(Suppl 1):205–212. - PubMed

Publication types