Meta-Analysis
. 2010 Feb 9;5(2):e9136.
doi: 10.1371/journal.pone.0009136.

Causal relationship of susceptibility genes to ischemic stroke: comparison to ischemic heart disease and biochemical determinants

Affiliations
Meta-Analysis

Causal relationship of susceptibility genes to ischemic stroke: comparison to ischemic heart disease and biochemical determinants

Paul Bentley et al. PLoS One. .

Abstract

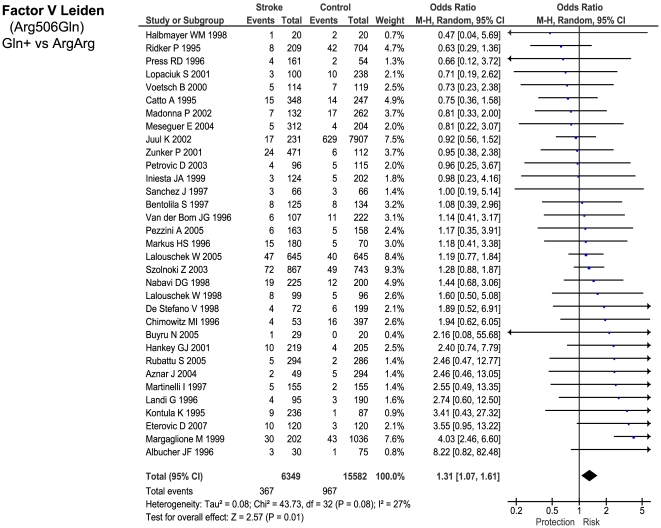
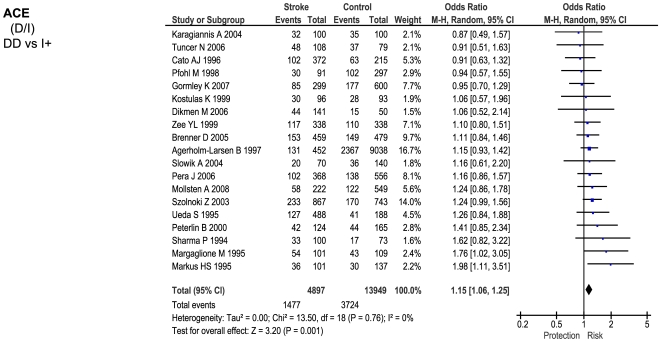
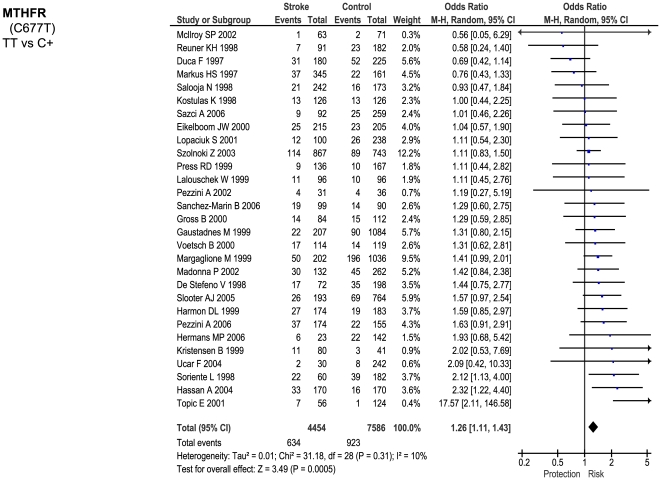
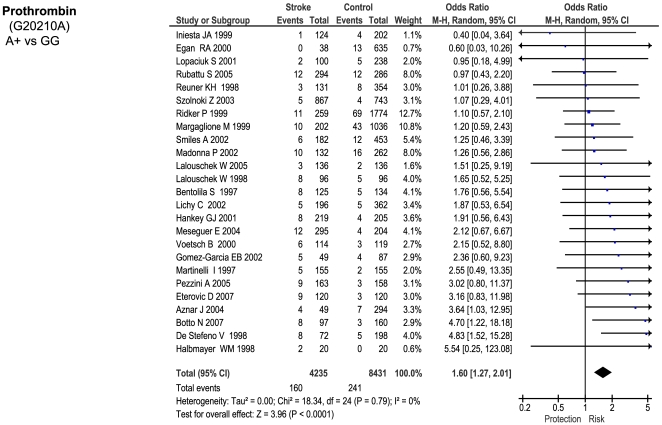
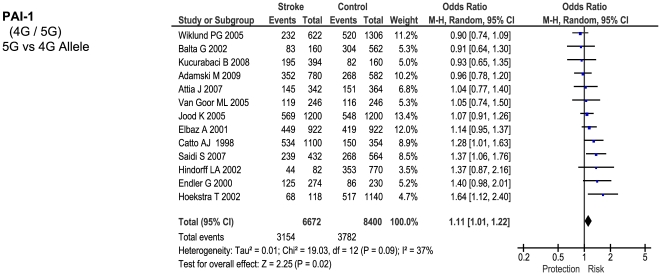
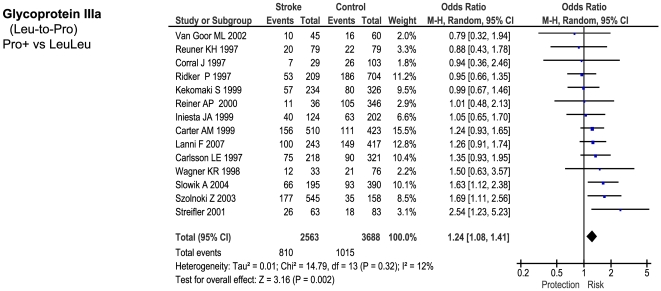
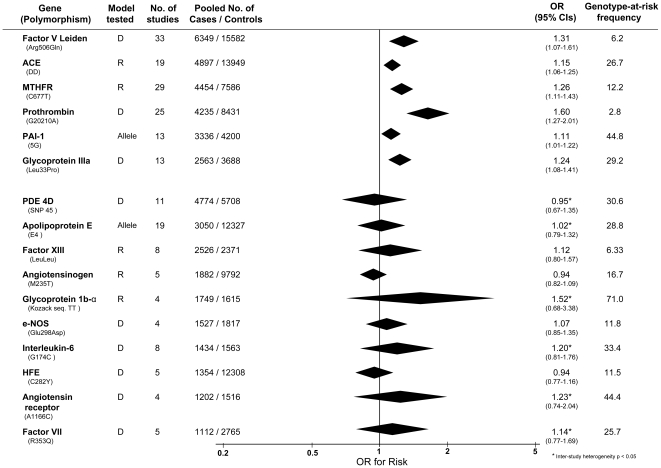
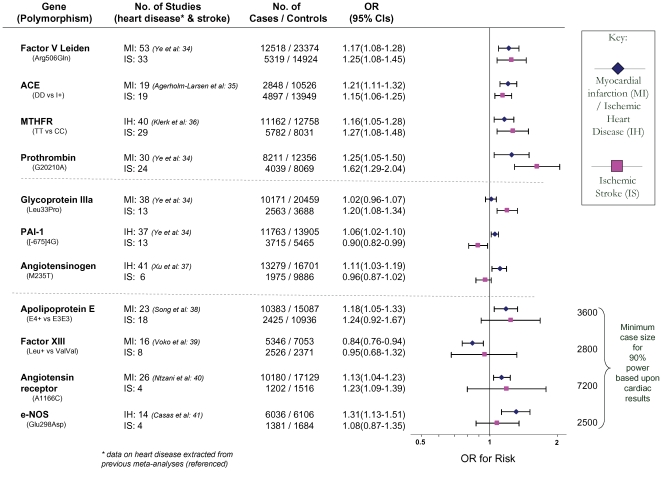
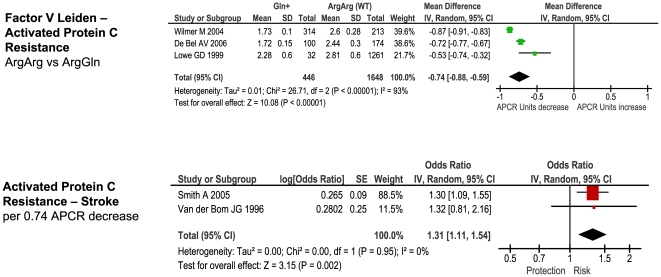
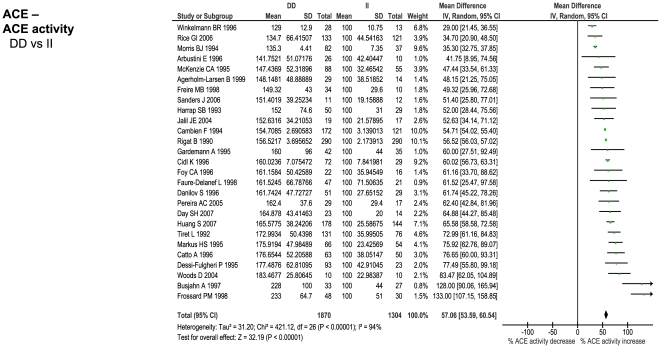
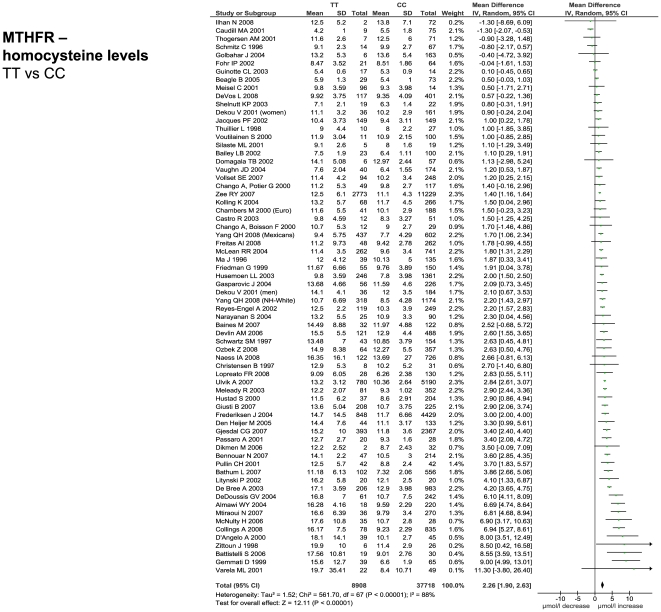
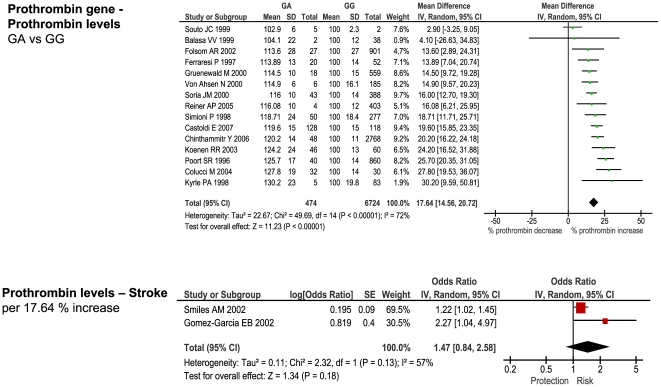
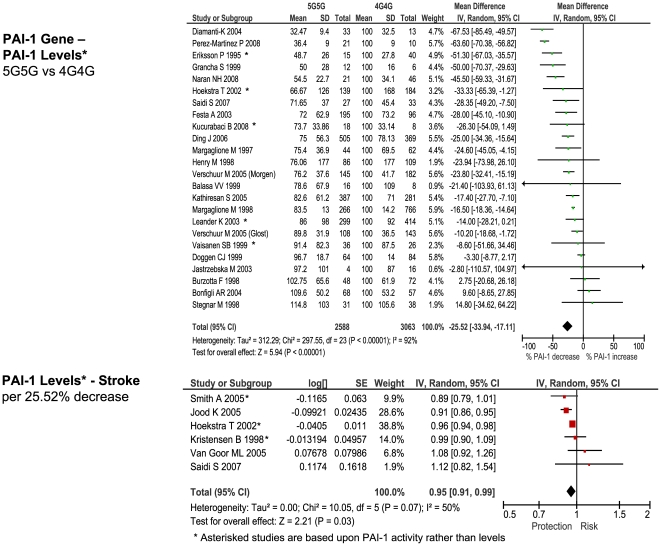
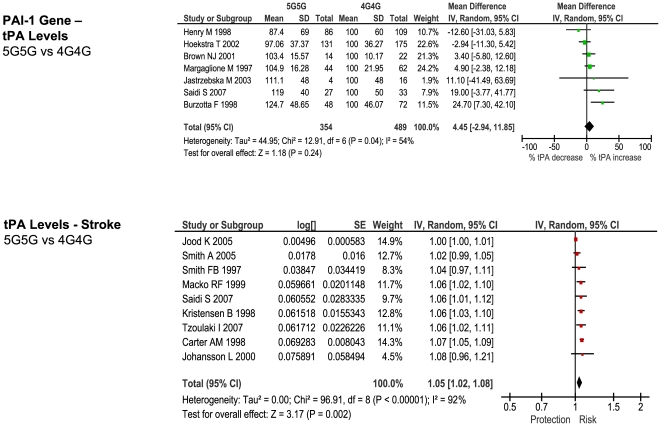
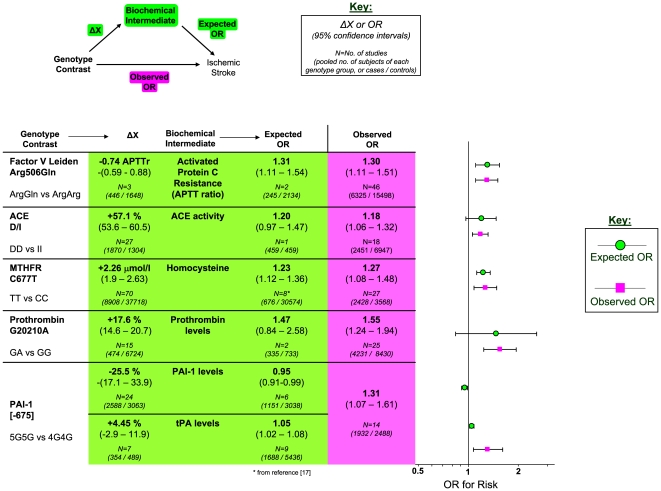
Interrelationships between genetic and biochemical factors underlying ischemic stroke and ischemic heart disease are poorly understood. We: 1) undertook the most comprehensive meta-analysis of genetic polymorphisms in ischemic stroke to date; 2) compared genetic determinants of ischemic stroke with those of ischemic heart disease, and 3) compared effect sizes of gene-stroke associations with those predicted from independent biochemical data using a mendelian randomization strategy. Electronic databases were searched up to January 2009. We identified: 1) 187 ischemic stroke studies (37,481 cases; 95,322 controls) interrogating 43 polymorphisms in 29 genes; 2) 13 meta-analyses testing equivalent polymorphisms in ischemic heart disease; and 3) for the top five gene-stroke associations, 146 studies (65,703 subjects) describing equivalent gene-biochemical relationships, and 28 studies (46,928 subjects) describing biochemical-stroke relationships. Meta-analyses demonstrated positive associations with ischemic stroke for factor V Leiden Gln506, ACE I/D, MTHFR C677T, prothrombin G20210A, PAI-1 5G allele and glycoprotein IIIa Leu33Pro polymorphisms (ORs: 1.11 - 1.60). Most genetic associations show congruent levels of risk comparing ischemic stroke with ischemic heart disease, but three genes--glycoprotein IIIa, PAI-1 and angiotensinogen--show significant dissociations. The magnitudes of stroke risk observed for factor V Leiden, ACE, MTHFR and prothrombin, but not PAI-1, polymorphisms, are consistent with risks associated with equivalent changes in activated protein C resistance, ACE activity, homocysteine, prothrombin, and PAI-1 levels, respectively. Our results demonstrate causal relationships for four of the most robust genes associated with stroke while also showing that PAI-1 4G/5G polymorphism influences cardiovascular risk via a mechanism not simply related to plasma levels of PAI-1 (or tPA) alone.


Conflict of interest statement

Competing Interests: The authors have declared that no competing interests exist.

Figures

Figure 1
Figure 1. Forest plots showing positive associations of ischemic stroke with the following genetic polymorphisms: Factor V Leiden Arg506Gln.
Figure 2
Figure 2. Forest plots showing positive associations of ischemic stroke with the following genetic polymorphisms: ACE D/I.
Figure 3
Figure 3. Forest plots showing positive associations of ischemic stroke with the following genetic polymorphisms: MTHFR C677T.
Figure 4
Figure 4. Forest plots showing positive associations of ischemic stroke with the following genetic polymorphisms: prothrombin G20210A.
Figure 5
Figure 5. Forest plots showing positive associations of ischemic stroke with the following genetic polymorphisms: PAI 5G allele.
Figure 6
Figure 6. Forest plots showing positive associations of ischemic stroke with the following genetic polymorphisms: glycoprotein IIIa Leu33Pro.
Figure 7
Figure 7. Summary of meta-analyses testing associations of candidate genetic polymorphisms with ischemic stroke.
Table reports genetic model tested (D – dominant; R – recessive); numbers of studies; numbers of pooled cases and controls; ORs with 95% confidence intervals, and at-risk genotype frequency.
Figure 8
Figure 8. Trends in success of candidate gene approach.
A: Numbers of pooled cases published over time testing for polymorphisms positively associated with stroke according to the present meta-analyses. B: As for A, but for polymorphisms found to show no stroke association according to the present meta-analysis. C: Changes in time of probability that cases were tested for polymorphism subsequently found to show association (red) or no association (green) with stroke.
Figure 9
Figure 9. Risk of genetic polymorphisms compared between ischemic stroke (IS) and ischemic heart disease (IH) or myocardial infarction (MI).
Contrasts represent per-allele effects except where indicated. Polymorphisms are grouped into those showing consistent associations for both types of disease; those showing dissociated effects; and those showing a significant risk of heart disease but not stroke. For the latter the minimum sample numbers estimated to achieve 90% power based upon each polymorphism's effect size for ischemic heart disease are shown.
Figure 10
Figure 10. Forest plots showing quantitative relationship between genetic polymorphisms and associated biochemical variables for: Factor V Leiden and activated Protein C resistance ratio.
Additional forest plots are shown in Figures 10, and 13– 15 that relate set changes in biochemical variables (determined from the first set of meta-analyses within each figure) with risk of stroke. For MTHFR and ACE this relationship is determined from a single study each.
Figure 11
Figure 11. Forest plots showing quantitative relationship between genetic polymorphisms and associated biochemical variables for: ACE D/I and ACE activity.
Additional forest plots are shown in Figures 10, and 13– 15 that relate set changes in biochemical variables (determined from the first set of meta-analyses within each figure) with risk of stroke. For MTHFR and ACE this relationship is determined from a single study each.
Figure 12
Figure 12. Forest plots showing quantitative relationship between genetic polymorphisms and associated biochemical variables for: MTHFR and homocysteine levels.
Additional forest plots are shown in Figures 10, and 13– 15 that relate set changes in biochemical variables (determined from the first set of meta-analyses within each figure) with risk of stroke. For MTHFR and ACE this relationship is determined from a single study each.
Figure 13
Figure 13. Forest plots showing quantitative relationship between genetic polymorphisms and associated biochemical variables for: Prothrombin G20210A and prothrombin levels.
Additional forest plots are shown in Figures 10, and 13– 15 that relate set changes in biochemical variables (determined from the first set of meta-analyses within each figure) with risk of stroke. For MTHFR and ACE this relationship is determined from a single study each.
Figure 14
Figure 14. Forest plots showing quantitative relationship between genetic polymorphisms and associated biochemical variables for: PAI-1 5G/4G and PAI-1 levels.
Additional forest plots are shown in Figures 10, and 13– 15 that relate set changes in biochemical variables (determined from the first set of meta-analyses within each figure) with risk of stroke. For MTHFR and ACE this relationship is determined from a single study each.
Figure 15
Figure 15. Forest plots showing quantitative relationship between genetic polymorphisms and associated biochemical variables for: PAI-1 5G/4G and tPA levels.
Additional forest plots are shown in Figures 10, and 13– 15 that relate set changes in biochemical variables (determined from the first set of meta-analyses within each figure) with risk of stroke. For MTHFR and ACE this relationship is determined from a single study each.
Figure 16
Figure 16. Comparison of estimated risk with observed risk for ischemic stroke-associated genetic polymorphisms.
Estimated ORs (green) are calculated from 1) meta-analyses relating risk-genotype with biochemical variation (ΔX), and 2) single studies or meta-analyses relating biochemical variation with stroke risk (scaled log-linearly). Observed ORs are derived from meta-analyses of the equivalent genotype contrast using the current datasets.

Similar articles

Cited by

References

    1. Johnston SC, Mendis S, Mathers CD. Global variation in stroke burden and mortality: estimates from monitoring, surveillance, and modelling. Lancet Neurol. 2009;8:345–354. - PubMed
    1. Chiuve SE, Rexrode KM, Spiegelman D, Logroscino G, Manson JE, et al. Primary prevention of stroke by healthy lifestyle. Circulation. 2008;118:947–954. - PMC - PubMed
    1. Arason GJ, Kramer J, Blaskó B, Kolka R, Thorbjornsdottir P, et al. Smoking and a complement gene polymorphism interact in promoting cardiovascular disease morbidity and mortality. Clin Exp Immunol. 2007;149:132–138. - PMC - PubMed
    1. Arnett DK, Baird AE, Barkley RA, Basson CT, Boerwinkle E, et al. American Heart Association Council on Epidemiology and Prevention; American Heart Association Stroke Council; Functional Genomics and Translational Biology Interdisciplinary Working Group; Relevance of genetics and genomics for prevention and treatment of cardiovascular disease. Circulation. 2007;115:2878–901. - PubMed
    1. Ioannidis JP, Boffetta P, Little J, O'Brien TR, Uitterlinden AG, et al. Assessment of cumulative evidence on genetic associations: interim guidelines. Int J Epidemiol. 2008;37:120–132. - PubMed

Publication types