. 2010 Feb 10;5(2):e9140.
doi: 10.1371/journal.pone.0009140.

Combinatorial effects of double cardiomyopathy mutant alleles in rodent myocytes: a predictive cellular model of myofilament dysregulation in disease

Affiliations

Combinatorial effects of double cardiomyopathy mutant alleles in rodent myocytes: a predictive cellular model of myofilament dysregulation in disease

Jennifer Davis et al. PLoS One. .

Abstract

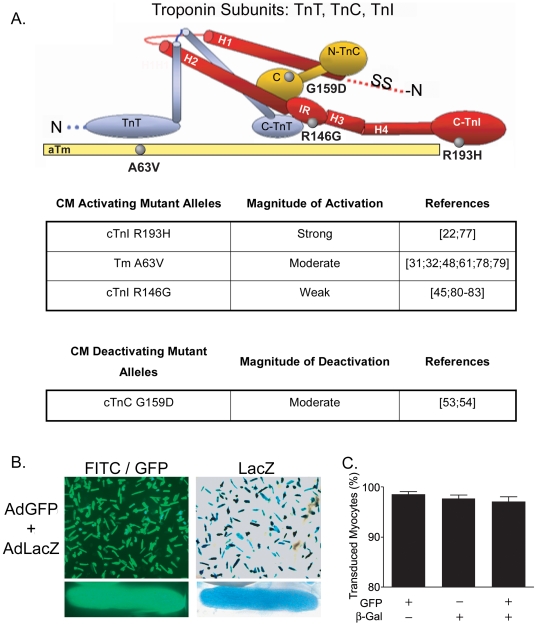
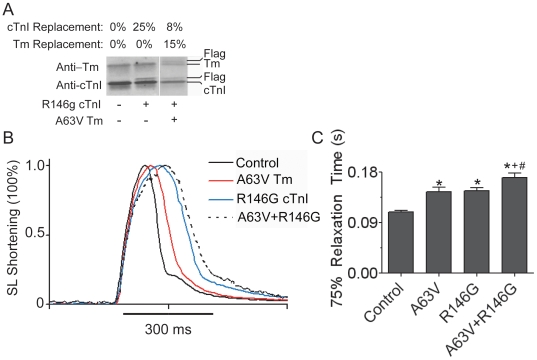
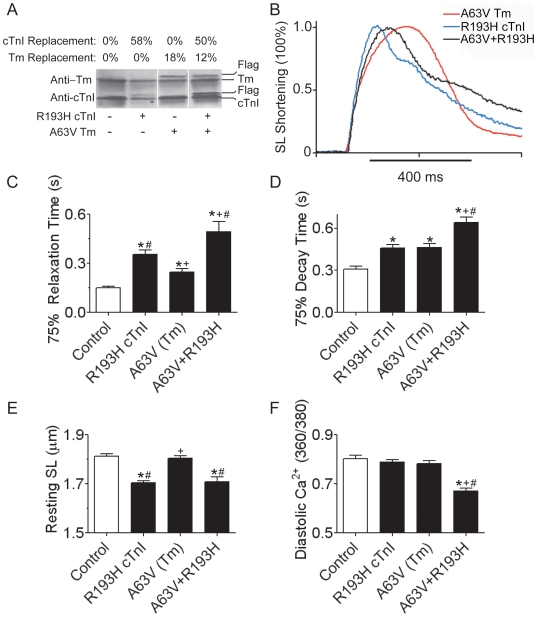
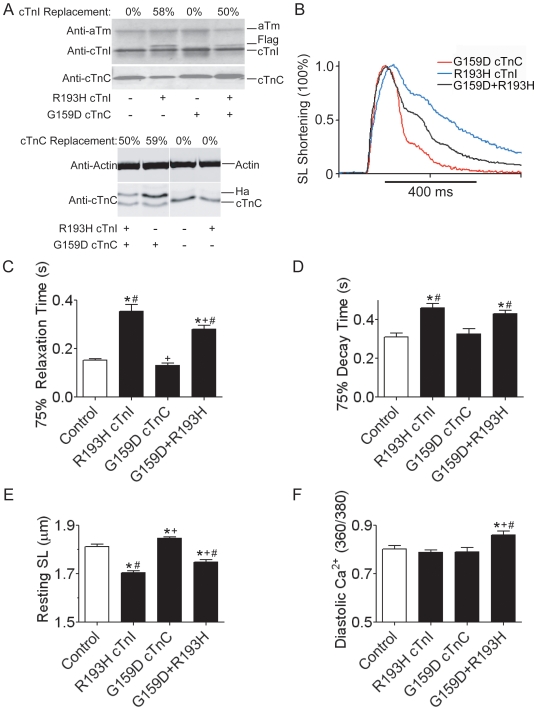
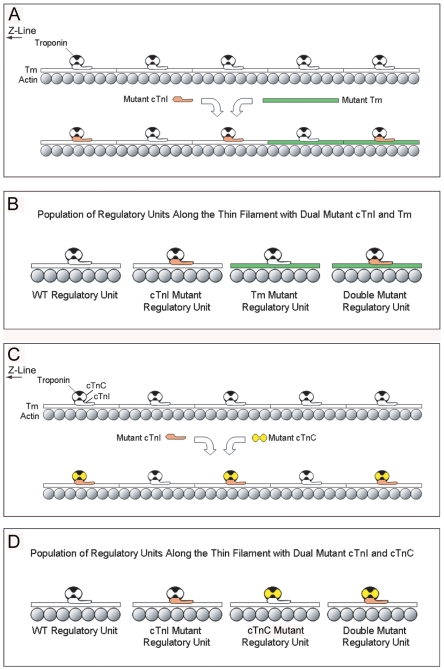
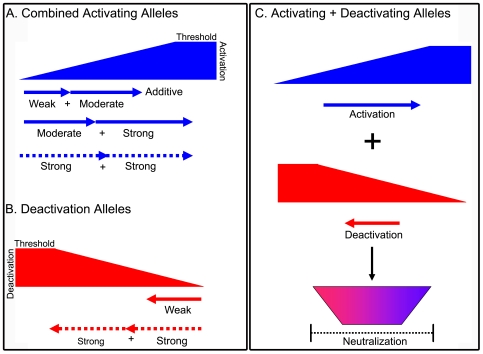
Inherited cardiomyopathy (CM) represents a diverse group of cardiac muscle diseases that present with a broad spectrum of symptoms ranging from benign to highly malignant. Contributing to this genetic complexity and clinical heterogeneity is the emergence of a cohort of patients that are double or compound heterozygotes who have inherited two different CM mutant alleles in the same or different sarcomeric gene. These patients typically have early disease onset with worse clinical outcomes. Little experimental attention has been directed towards elucidating the physiologic basis of double CM mutations at the cellular-molecular level. Here, dual gene transfer to isolated adult rat cardiac myocytes was used to determine the primary effects of co-expressing two different CM-linked mutant proteins on intact cardiac myocyte contractile physiology. Dual expression of two CM mutants, that alone moderately increase myofilament activation, tropomyosin mutant A63V and cardiac troponin mutant R146G, were shown to additively slow myocyte relaxation beyond either mutant studied in isolation. These results were qualitatively similar to a combination of moderate and strong activating CM mutant alleles alphaTmA63V and cTnI R193H, which approached a functional threshold. Interestingly, a combination of a CM myofilament deactivating mutant, troponin C G159D, together with an activating mutant, cTnIR193H, produced a hybrid phenotype that blunted the strong activating phenotype of cTnIR193H alone. This is evidence of neutralizing effects of activating/deactivating mutant alleles in combination. Taken together, this combinatorial mutant allele functional analysis lends molecular insight into disease severity and forms the foundation for a predictive model to deconstruct the myriad of possible CM double mutations in presenting patients.


Conflict of interest statement

Competing Interests: The authors have declared that no competing interests exist.

Figures

Figure 1
Figure 1. Thin filament regulatory protein targets and efficiency of dual gene transfer.
(A) Schematic representation of the troponin subunits, troponin I (TnI), troponin T (TnT), and troponin C (TnC) and tropomyosin (Tm) the location of CM-linked mutations (gray circles) with in the secondary structure of troponin and tropomyosin. (B) Representative images (10X) of cultured adult rat cardiac myocytes co-transduced with the eGFP (200 MOI) and Lac Z genes (200 MOI) 3 days post gene transfer. Bottom panel is a 40X image of one myocyte expressing both eGFP and β-galactosidase. (C) Summary of the ratio of transduced to total myocytes in a field. Approximately 98% of myocytes are expressing both eGFP and β-galactosidase by day four in cultured myocytes co-transduced with adenovirus containing the eGFP and Lac Z genes. Data is presented as mean+SEM, n = 5 preparations.
Figure 2
Figure 2. Intact single myocyte shortening from double activating mutations in αTm and cTnI.
(A) Representative Western blot showing non-transduced (WT), R146G cTnI, and A63V Tm + R146G cTnI myocytes. Blots were probed with anti-Tm and anti-cTnI antibodies. (B) Sarcomere shortening transients from WT, A63V Tm, R146G cTnI, and A63V+R146G transduced myocytes. Traces were normalized to peak shortening to emphasize the mutant dependent slowing of relaxation. (C) Summary of 75% sarcomere relaxation time. Relaxation time was determined by calculating the difference from the time of peak shortening to 75% relaxation. Values are represented as the mean+SEM and Newman-Keuls post hoc comparisons defined as follows: (*) different from WT, (+) different from R146G cTnI, (#) different from A63V Tm, P<0.05, myocytes were derived from a minimum of 5 different rat heart isolations with n = 45 WT, n = 40 R146G, and n = 40 A63V+R146G myocytes.
Figure 3
Figure 3. Intact single myocyte shortening and Ca2+ transients from double activating αTm and RCM cTnI mutants.
(A) Representative Western blot from myocytes transduced with R193H cTnI, A63V Tm, or both R193H cTnI and A63V Tm. Non-transduced myocytes served as controls. Blots were probed with anti-Tm, anti-cTnI antibodies and anti-TnC was used as a loading control (not shown). (B) Representative sarcomere shortening transients from A63V Tm (HCM), R193H cTnI (RCM), and A63V+R193H transduced myocytes. Traces were normalized to peak shortening to emphasize the mutant dependent slowing of relaxation. (C) Summary of 75% sarcomere relaxation time and (D) Ca2+ transient decay time. Relaxation and decay times were determined by calculating the difference from the time of peak shortening/fluorescence to 75% relaxation/decay. (E) Summary of baseline sarcomere lengths and (F) resting Ca2+ for all of the experimental groups. Values are represented as the mean + SEM, and Newman-Keuls post hoc comparisons defined as follows: (*) different from WT, (+) different from R193H cTnI, (#) different from A63V Tm or G159D cTnC, P<0.05, myocytes were derived from a minimum of 5 different rat heart isolations with n = 63/43 WT, n = 64/44 R193H, n = 29/19 A63V,and n = 29/29 A63V+R193H myocytes used for shortening/Ca2+ cycling experiments.
Figure 4
Figure 4. Intact single myocyte shortening and Ca2+ transients from a deactivating cTnC and activating cTnI mutant combination.
(A) Representative Western blot from myocytes transduced with R193H cTnI, G159D cTnC, or both R193H cTnI and G159D cTnC. Non-transduced myocytes served as controls. Blots were probed with anti-cTnI (top panel) and anti-cTnC (bottom panel) antibodies and anti-Tm was used as a loading control. (B) Representative sarcomere shortening transients from G159D cTnC, R193H cTnI, and G159D cTnC + R193H cTnI transduced myocytes. Traces were normalized to peak shortening to emphasize the mutant dependent slowing of relaxation. (C) Summary of 75% sarcomere relaxation time and (D) Ca2+ transient decay time. Relaxation and decay times were determined by calculating the difference from the time of peak shortening/fluorescence to 75% relaxation/decay. (E) Summary of baseline sarcomere lengths and (F) resting Ca2+ for all of the experimental groups. Values are represented as the mean + SEM, and Newman-Keuls post hoc comparsions defined as follows: (*) different from WT, (+) different from R193H cTnI, (#) different from G159D cTnC, P<0.05, myocytes were derived from a minimum of 5 different rat heart isolations with n = 63/43 WT, n = 64/44 R193H, n = 36/19 G159D,and n = 36/26 G159D+R193H myocytes used for shortening/Ca2+ cycling experiments.
Figure 5
Figure 5. Model of dual gene transfer incorporation of mutant Tm + cTnI and cTnC + cTnI combinations.
(A) Native cTnI and αTm is shown in white. This model predicts that mutant Tm (green) has ordered incorporation starting at the pointed end and moving towards the Z-line, while the simultaneous transduction of mutant cTnI (red) will stochastically incorporate along the thin filament. As such double mutant regulatory units containing both mutant Tm and cTnI are located at the pointed end of the thin filament in this dual gene transfer approach. (B) Schematic depicting the predicted population of regulatory units that decorate the thin filament in this model system and in CM patients. Four populations of regulatory units consisting of wild type (WT), mutant cTnI alone, mutant Tm alone, and both mutant cTnI and TM (double mutant) are predicted to constitute the thin filament regulatory system as a whole. The relative proportion of units will be directly related to the percent replacement of native Tm and cTnI that in a patient will reach an even and random distribution overtime as the thin filaments turn-over. In our model system, TmA63V + cTnIR193H myocytes very few double mutant regulatory units are predicted as R193H mutant cTnI will be randomly distributed while only 10% should contain A63V Tm. (C) Native cTnI and cTnC are shown in white. This model predicts that like mutant cTnI (red), mutant cTnC (yellow) will have stochastic incorporation. Regulatory units containing both mutant cTnC and cTnI are randomly decorated along the entire length of the thin filament. The incorporation of mutant cTnC is predicted to follow cTnI. (D) Schematic depicting the predicted population of regulatory units that decorate the thin filament with this dual gene transfer approach. Four populations consisting of wild type (WT), mutant cTnI alone, mutant cTnC alone, and both mutant cTnI and cTnC (double mutant) regulatory units are predicted to constitute the thin filament regulatory system in our model and in CM patients. If mutant cTnC follows cTnI then the population of single mutant regulatory units should approach zero with double mutant and WT regulatory units being more prominent and in a 50∶50 distribution. The relative proportion of double mutant regulatory units is predicted to be directly related to the percent replacement of native cTnC and cTnI.
Figure 6
Figure 6. Working model of additive and neutralizing outcomes for double heterozygous genotypes based on the combine effects of allele-specific thin filament activation.
In the models depicted in all panels the arrows represent the individual allele as a linear vector. The length of the arrow represent the magnitude of activation/deactivation of the thin filament caused by the mutant allele alone, which is classified as weak, moderate, or strong. The arrow's direction represents the allele's alteration of thin filament activation in which a rightward pointing arrow (positive direction) represents activation and a leftward pointing (negative direction) arrow represents deactivation. (A) Double Activating Allele Model: the positive sloping gradient represents the additive slowing of relaxation and heightened severity of diastolic dysfunction that occurs with the combination of two activating mutant alleles from different sarcomeric loci. The combination of two activating alleles is represented by adding two activating allele vectors together, which yields a higher degree of activation and thus more severe diastolic dysfunction. Some double activating allele combinations may cause the thin filament to become saturated thereby approaching a threshold of activation in which the combination of two vectors is not additive on a one to one basis. (B) Double Deactivating Allele Model: the negative sloping gradient represents the predicted additive consequence to accelerate relaxation and reduce contractility that occurs with the combination of two deactivating mutant alleles from different sarcomeric loci. The combination of two deactivating alleles is represented by adding two activating allele vectors together but in the negative direction, which yields a higher degree of deactivation and thus altered contractility with enhanced relaxation. Some double deactivating allele combinations may also result in saturation thereby approaching a threshold of deactivation. (C) Mixed Model of Activating + Deactivating Alleles: the combination of two alleles with different activation properties is depicted by the addition of a positive gradient and vector (activating allele) and a negative gradient and vector (deactivating allele). This combination results in mitigating effects, in which the primary phenotypes of each individual mutant are neutralized (represented by the trapezoid) when the opposing alleles are co-expressed.

Similar articles

Cited by

References

    1. Maron BJ, Gardin JM, Flack JM, Gidding SS, Kurosaki TT, et al. Prevalence of hypertrophic cardiomyopathy in a general population of young adults. Echocardiographic analysis of 4111 subjects in the CARDIA Study. Coronary Artery Risk Development in (Young) Adults. Circulation. 1995;92:785–789. - PubMed
    1. Braunwald E, Seidman CE, Sigwart U. Contemporary evaluation and management of hypertrophic cardiomyopathy. Circulation. 2002;106:1312–1316. - PubMed
    1. Maron BJ, Towbin JA, Thiene G, Antzelevitch C, Corrado D, et al. Contemporary definitions and classification of the cardiomyopathies: an American Heart Association Scientific Statement from the Council on Clinical Cardiology, Heart Failure and Transplantation Committee; Quality of Care and Outcomes Research and Functional Genomics and Translational Biology Interdisciplinary Working Groups; and Council on Epidemiology and Prevention. Circulation. 2006;113:1807–1816. - PubMed
    1. Doolan A, Nguyen L, Semsarian C. Hypertrophic cardiomyopathy: from “heart tumour” to a complex molecular genetic disorder. Heart Lung Circ. 2004;13:15–25. - PubMed
    1. NHLBI Program for Genomic Applications HMS. Genomics of Cardiovascular Development, Adaptation, and Remodeling. 7 A.D. June. http://www.cardiogenomics.org.

Publication types

MeSH terms